MBRRACE-UK perinatal mortality surveillance
UK perinatal deaths of babies born in 2024
State of the nation report
1. Introduction
1.1. About this report
This is the twelfth report from MBRRACE-UK looking at baby deaths in the UK shortly before, during, or soon after birth. It is broken down into five main parts:
- How many baby deaths happen across the UK.
- How the rates of baby deaths for individual trusts and health boards vary.
- How rates of baby deaths vary depending on how far along the pregnancy was.
- How ethnicity and socioeconomic factors (like the area someone lives in) affect baby deaths.
- A look at the causes of these deaths.
1.2. More information and resources
To help you understand this report better, we have also provided:
- Reference tables with more detailed numbers;
- An interactive data viewer that shows mortality rates for individual trusts and health boards, and other types of organisations; and
- A guide to our methods that explains exactly how we collect and analyse our data.
A printable version of the report is available to download as a PDF. You can also view and download a summary infographic below.
We use different words to refer to different times when a baby dies:
- A late fetal loss is when a baby is born at 22 to 23 weeks gestational age without any signs of life.
- A stillbirth is when a baby is born at 24 or more weeks gestational age without any signs of life.
- A neonatal death is when a baby is born at any gestational age who lives, even briefly, but dies within 4 weeks of birth.
- Stillbirths and neonatal deaths combined are known as extended perinatal deaths
Gestational age is how far along the pregnancy was when the baby was born. This is measured in completed weeks of pregnancy. We mostly report on deaths of babies born at 24 weeks or later. Since babies born before 24 weeks are at much higher risk of dying, we look at them separately to better understand the risks for that group. We also do this to avoid confusion, as clinical practice has varied for babies born before 24 weeks, which has affected whether these deaths were recorded as a neonatal death or a late fetal loss.
The mortality rate is the number of baby deaths compared to the number of births. We calculate separate rates for each type of death and show them as the number of deaths for every 1,000 births. For example, a stillbirth rate of 3.0 means that for every 1,000 babies born, three were stillborn. We do not include terminations of pregnancy in any of the rates we report.
In our reports and the supporting materials we use the words ‘women’ and ‘mothers’. However, we acknowledge that not everyone who uses perinatal services identifies as a woman or mother. Our recommendations apply to all people who are pregnant or have given birth. Similarly, when we say ‘parents’ we mean anyone who has the main responsibility of caring for a baby.
There are other important words which you can hover over or click on to read the definition. You can find a full list of the important words we use, and what they mean, in our methods guide. You'll also find a list of all the abbreviations we use, and what they stand for.
2. Baby deaths across the UK: 2024
We looked at data on stillbirths, neonatal deaths and extended perinatal deaths across the UK. This information is broken down by the mother’s country of residence for the entire UK and for each nation (England, Scotland, Wales, and Northern Ireland) from 2013 to 2024. We do this to show how these rates have changed over time and help each nation track the effectiveness of their efforts to reduce the number of babies who die.
Rates of baby death continued to decrease in 2024
Compared with 2023, stillbirth, neonatal mortality and extended perinatal mortality rates were lower in England and for the UK as a whole.
In Scotland, Wales and Northern Ireland, rates tend to vary more each year because there are fewer births in these countries. This means that changes seen over a single year do not always reflect longer-term patterns, so it is important to look at trends over a longer period of time.
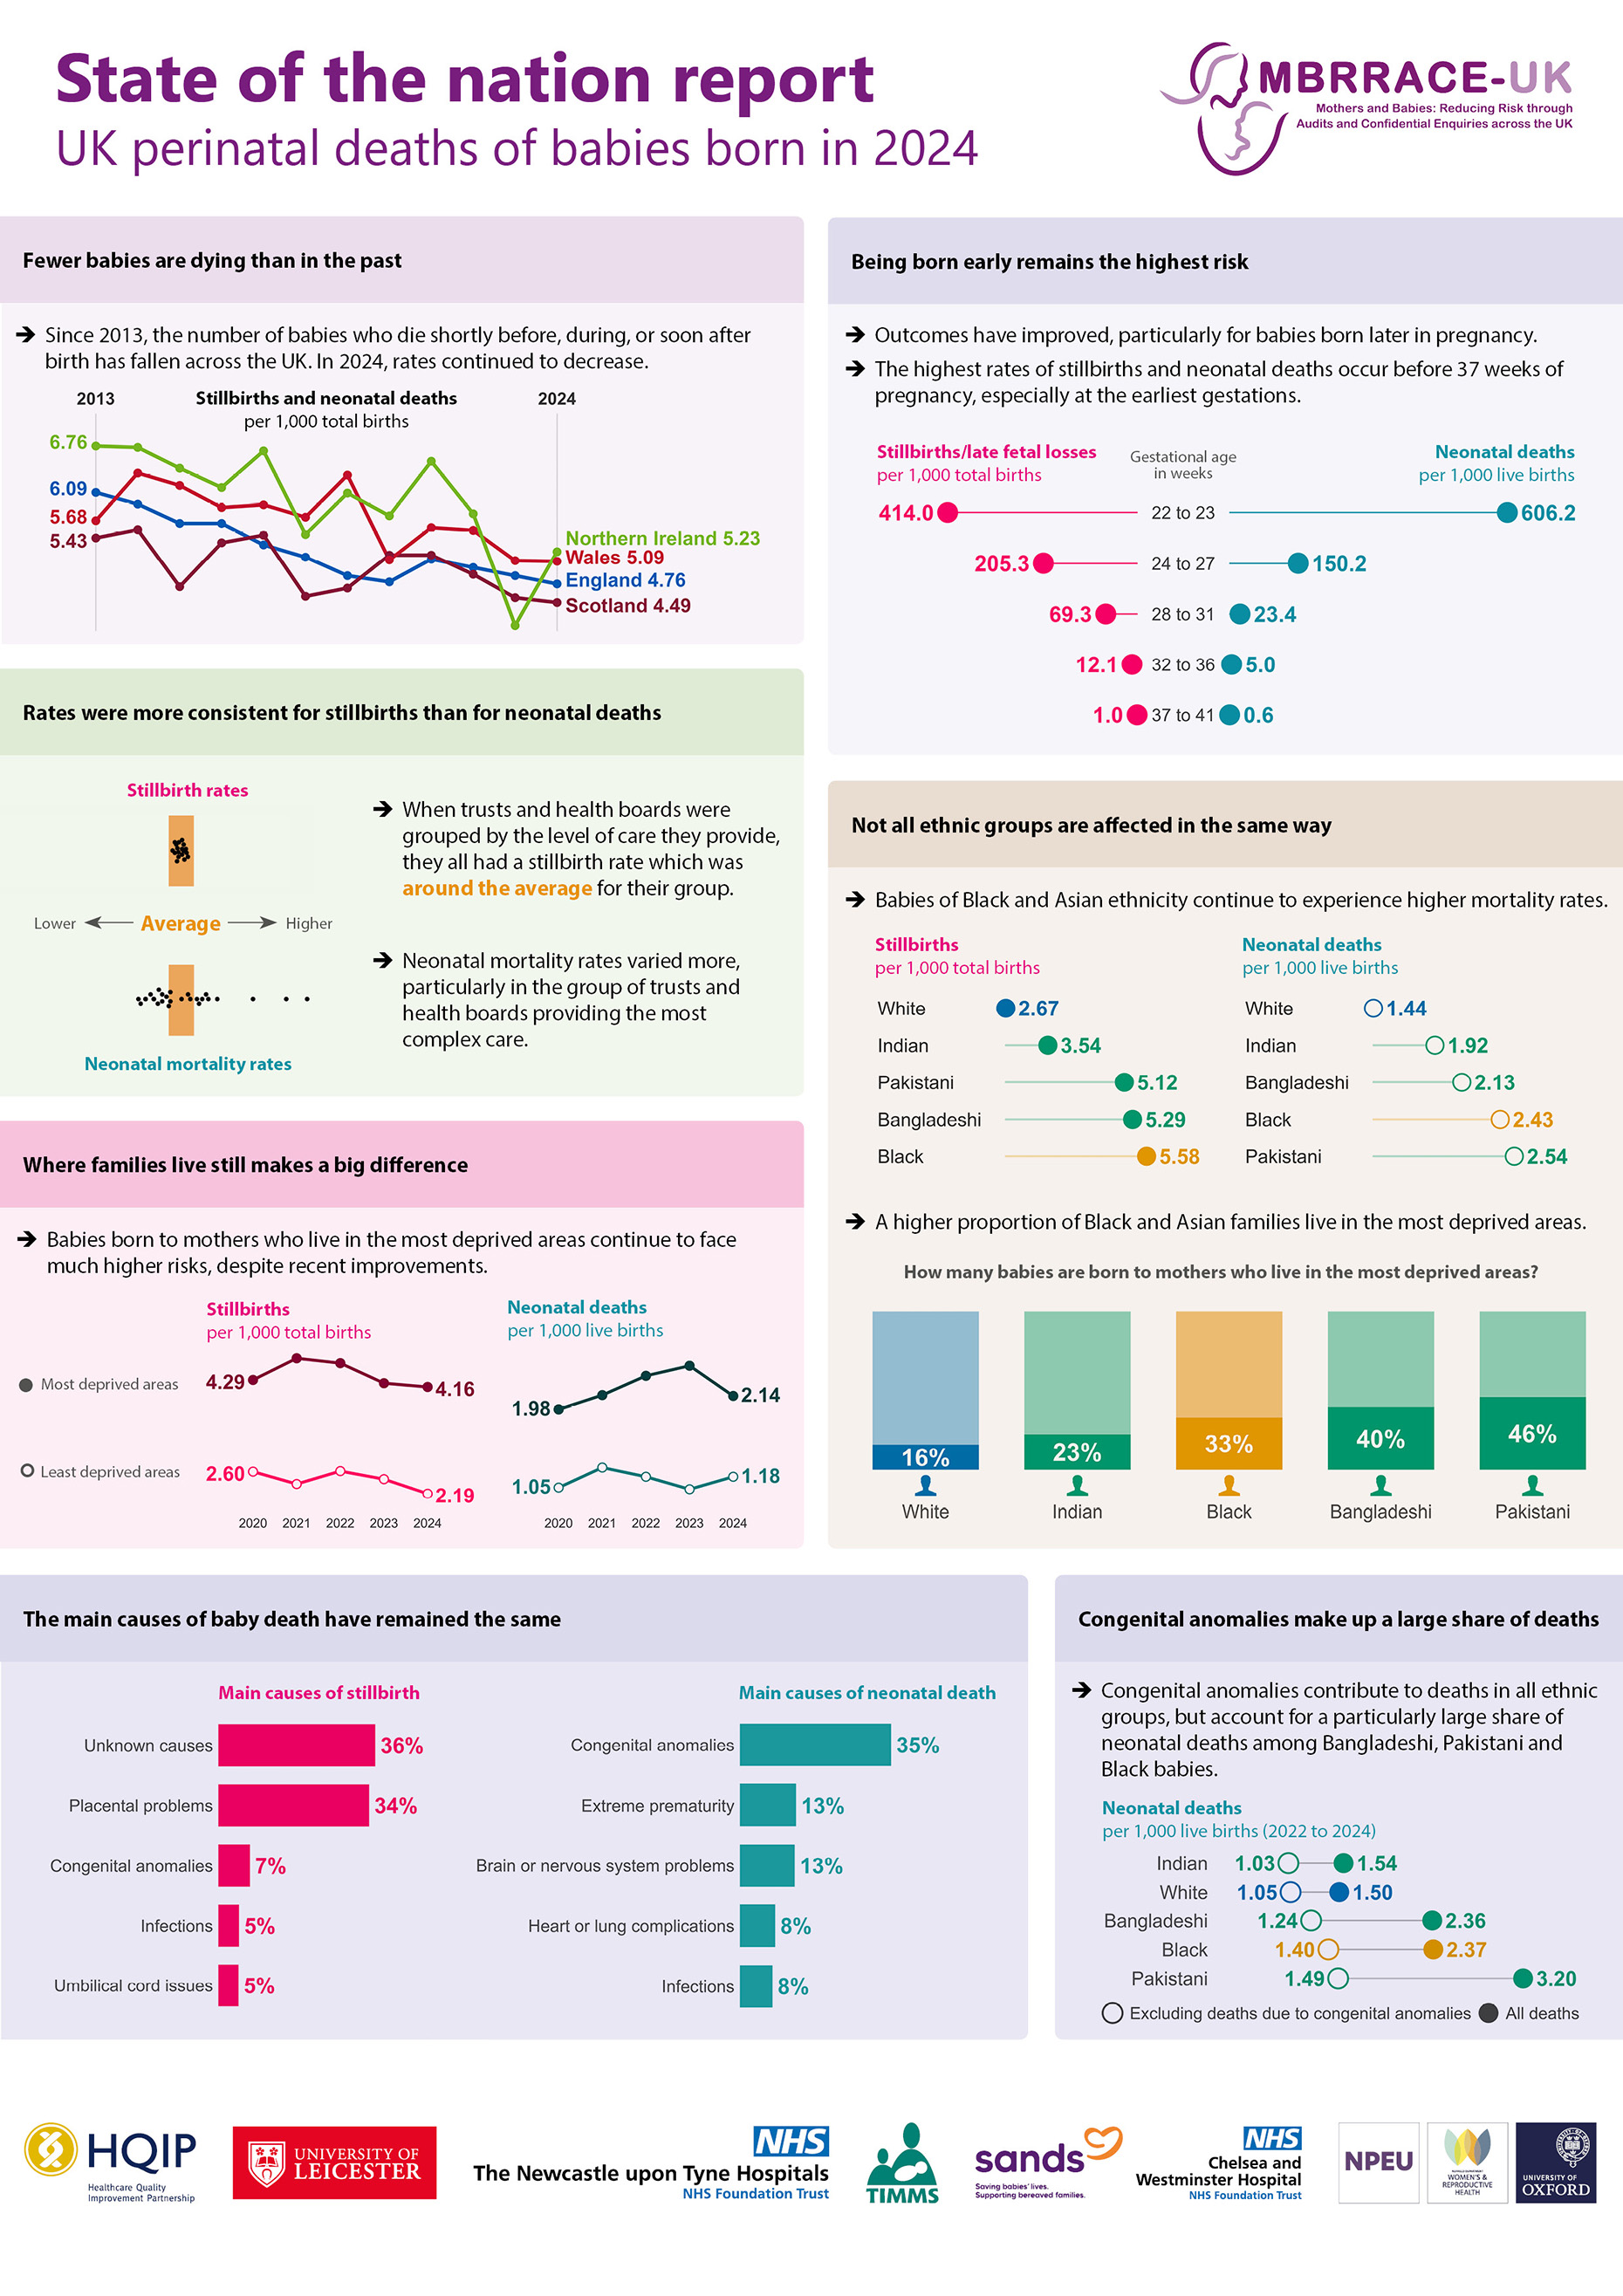
Since MBRRACE-UK began in 2013, the number of babies who died shortly before, during, or soon after birth has been falling across all UK nations. In 2024, the UK extended perinatal mortality rate was 4.77 baby deaths for every 1,000 births, which is 21% lower than in 2013.
Data sources: MBRRACE-UK, PDS, ONS, NRS, PHS, NIMATS, States of Guernsey, States of Jersey.
Description of Figure 1: Line charts showing trends in stillbirth, neonatal mortality and extended perinatal mortality rates for the UK, England, Scotland, Wales and Northern Ireland between 2013 and 2024. Stillbirth rates are shown overall and separately for antepartum and intrapartum deaths. Stillbirth and extended perinatal mortality rates are shown per 1,000 total births. Neonatal mortality rates are shown per 1,000 live births. Babies born at less than 24 completed weeks’ gestational age and terminations of pregnancy are excluded.
3. Perinatal mortality rates for trusts and health boards
To make comparisons between trusts and health boards fairer, we place them into five comparator groups based on the level of care they provide — for example, whether they have a neonatal intensive care unit (NICU). Some hospitals care for pregnant women with higher health risks or look after babies who are sicker, either because they offer specialist services or serve communities with specific social or health challenges. Even with excellent care, this can lead to higher mortality rates.
Because the number of deaths at a hospital can vary from year to year just by chance, we use a statistical process called stabilisation to smooth out this random variation. We also adjust the rates to account for important risk factors such as the mother’s age, socioeconomic background, the baby’s ethnicity and sex, whether it was a twin or triplet, and how early in pregnancy the baby was born. These stabilised and adjusted mortality rates give us a clearer picture of whether a trust or health board has a higher or lower rate than expected. We then compare their rates to the average in their group to help us understand how they are doing.
You can find out more about how we calculate mortality rates in our guide to our methods
Stillbirth rates were similar across most trusts and health boards, but neonatal mortality rates varied more.
For stillbirths, all trusts and health boards had a stabilised and adjusted stillbirth rate within 5% of the average rate for their comparator group. There was more variation in neonatal mortality rates, with only 24% falling within that range. You can explore individual trust and health board rates in our data viewer.
It is important to remember that mortality rates describe what happened over a period of time, but they may not reflect the quality of care. To understand these numbers properly, it is essential to consider the type of population being cared for and how services are organised in different areas. This is especially important for neonatal mortality, as trusts and health boards with the highest rates often care for the sickest and most premature babies.
Data sources: MBRRACE-UK, PDS, ONS, NRS, PHS, NIMATS, States of Guernsey, States of Jersey.
Description of Figure 2: Scatter charts showing the variation in stabilised and adjusted stillbirth, neonatal mortality and extended perinatal mortality rates within trust and health board comparator groups in 2024. Trusts and health boards are grouped according to the level of services they provide. Each dot represents an individual trusts or health board, and a vertical line shows the average rate for that comparator group. Stillbirth and extended perinatal mortality rates are shown as rates per 1,000 total births. Neonatal mortality rates are shown as rates per 1,000 live births. Babies born at less than 24 completed weeks’ gestational age and terminations of pregnancy are excluded.
Additional data on maternity and neonatal services
Detailed data on the care provided by maternity and neonatal services is available from the National Maternity & Perinatal Audit (NMPA) and the National Neonatal Audit Programme (NNAP). The NMPA measures various aspects of maternity and neonatal care provided by NHS maternity services in England, Scotland and Wales. The NNAP assesses whether babies admitted to neonatal units in England, Scotland, Wales and the Isle of Man receive consistent high quality care.
4. Mortality rates by gestational age
We looked at mortality rates based on the gestational age when the baby was born. We do this to keep an eye on how well national programs are working to improve outcomes for babies born prematurely.
Most baby deaths occurred before 37 weeks, despite improving outcomes.
Over the past five years, mortality rates have generally fallen, especially for babies born later in pregnancy. There has also been a recent reduction in the neonatal mortality rate for babies born at 28 to 31 weeks, following several years of little change.
Most stillbirths and neonatal deaths were of babies born before 37 weeks of pregnancy, particularly at the earliest gestations. Babies born very early will always face higher risks because of how early they are born. As a result, they continue to account for a large share of deaths, even as outcomes improve overall.
Stillbirths and late fetal losses
Neonatal deaths
Data sources: MBRRACE-UK, PDS, ONS, NRS, PHS, NIMATS, States of Guernsey, States of Jersey.
Description of Figure 3: Combined line and bar charts showing rates and proportions of late fetal losses, stillbirths and neonatal deaths for babies born in the UK from 2020 to 2024, by gestational age group in completed weeks: 22 to 23, 24 to 27, 28 to 31, 32 to 36, 37 to 41. Deaths of babies born at 42 weeks and above are not shown because there are very small numbers of births at this gestation. Late fetal loss and stillbirth rates are shown per 1,000 total births, and neonatal mortality rates are shown per 1,000 live births. Terminations of pregnancy are excluded. The scale on the left-hand vertical axis differs between gestational age groups.
5. Mortality rates by socioeconomic deprivation and ethnicity
We looked at differences in stillbirth and neonatal death rates to understand if there are inequalities. We compared these rates based on two factors: where the mother lives, using her postcode to understand the level of financial disadvantage (socioeconomic deprivation) in that area, and the baby’s ethnic group.
Inequalities in perinatal mortality remain large despite recent improvements
Differences linked to socioeconomic deprivation continue to be a major concern. Stillbirth rates remain highest among babies born to mothers who live in the most deprived areas, although the rate for this group has fallen since 2023.
For neonatal mortality, the gap between the most and least deprived areas narrowed slightly after several years of widening. Even so, rates for babies born to mothers who live in the most deprived areas were still much higher than for those in the least deprived areas. This is despite a 14% reduction in neonatal mortality rates for the most deprived group.
Data sources: MBRRACE-UK, PDS, ONS, NRS, PHS, NIMATS.
Description of Figure 4: Line charts showing stillbirth and neonatal mortality rates by level of socioeconomic deprivation, 2020 to 2024. Deprivation is shown by quintiles numbered 1 to 5, and the most deprived quintile (Q5) is compared to the least deprived quintile (Q1). Stillbirth rates are shown per 1,000 total births and neonatal mortality rates are shown per 1,000 live births. Babies born at less than 24 completed weeks’ gestational age and terminations of pregnancy are excluded. The scale on the left-hand vertical axis differs for each chart.
We measured socioeconomic deprivation using the Children in low-income families local measure (for births until 2022) and the Children in low income families: local area statistics (for births in 2023 onwards), based on where the mother lived when the baby was born.
Ethnic differences in mortality rates continued
Between 2023 and 2024, stillbirth rates continued to fall across almost all ethnicities, reflecting a longer‑term improvement since 2020. For neonatal mortality, the overall pattern shows only small shifts despite recent improvements in some ethnic groups.
Despite overall progress, babies of Asian and Black ethnicity continue to experience higher mortality rates than babies of White ethnicity.
Data sources: MBRRACE-UK, PDS, ONS, NRS, PHS, NIMATS, States of Guernsey, States of Jersey.
Description of Figure 4: Line charts showing stillbirth and neonatal mortality rates by babies’ ethnicity, between 2020 and 2024. Rates for babies of Black ethnicity combine several smaller subgroups because the numbers of deaths for babies of Black Caribbean and Other Black ethnicities are too small to report separately. Stillbirth rates are shown per 1,000 total births, and neonatal mortality rates are shown per 1,000 live births. Babies born at less than 24 completed weeks’ gestational age and terminations of pregnancy are excluded. The scale on the left-hand vertical axis differs for each chart.
Socioeconomic deprivation affects some ethnic groups more than others
Babies of Asian Bangladeshi, Asian Pakistani and Black ethnicity already have the highest rates of stillbirth and neonatal death when looking at ethnicity alone. These three groups also have a much larger proportion of babies born to mothers living in the most deprived areas. This means that the effects of socioeconomic deprivation add to these already higher rates.
For some ethnic groups, very few births occur in the least deprived quintile. When the number of births is small, even a small change in the number of deaths can cause large swings in the mortality rate. As a result, in some groups, the rate for the least deprived quintile can occasionally appear higher than the rate for the most deprived quintile, simply because the numbers are so small.
Stillbirths
Neonatal deaths
Data sources: MBRRACE-UK, PDS, ONS, NRS, PHS, NIMATS.
Description of Figure 6: Dumbbell charts showing stillbirth and neonatal mortality rates by babies' ethnicity and level of socioeconomic deprivation, for babies born in the UK between 2022 and 2024. Deprivation is shown in quintiles and the charts compare the most deprived quintile with the least deprived. Each dumbbell shows the difference between the most deprived to the least deprived within an ethnic group. Bubble sizes represent the proportion of births to mothers living in each deprivation quintile for that ethnic group; the smallest bubble represents the smallest share of births. Rates for babies of Black ethnicity combine several smaller subgroups because the numbers of deaths for babies of Black Caribbean and Other Black ethnicities are too small to report separately. Stillbirth rates are shown per 1,000 total births, and neonatal mortality rates are shown per 1,000 live births. Babies born at less than 24 completed weeks’ gestational age and terminations of pregnancy are excluded. Data for 2022 to 2024 are combined because the number of deaths in some ethnic and deprivation groups is small, and combining the years makes the rates more reliable.
6. Causes of perinatal death
We looked at the reasons babies died, using a system called CODAC to classify both the main reason a baby died and any other related health conditions that might have played a role. We also looked at how congenital anomalies affect baby deaths in different ethnic groups.
The most common causes of baby death were unchanged.
The main causes of stillbirth were problems with the placenta, congenital anomalies, issues with the umbilical cord, and fetal health conditions that developed during pregnancy — such as problems with the baby’s organs, blood or immune system. For a large proportion of stillbirths the cause of death was unknown.
Neonatal deaths were most often caused by congenital anomalies, problems with the brain or nervous system, extreme prematurity, heart or lung complications, and infections.
Stillbirths
Neonatal deaths
Data source: MBRRACE-UK.
Description of Figure 7: Bar charts showing the five most common causes of stillbirth and neonatal death, between 2020 and 2024. Babies born at less than 24 completed weeks’ gestational age and terminations of pregnancy are excluded.
Congenital anomalies affect mortality rates differently across ethnic groups
Congenital anomalies contributed to baby deaths in every ethnic group, but their impact was not the same for all babies.
They had the largest effects on neonatal mortality rates for babies of Asian Bangladeshi, Asian Pakistani and Black ethnicity. When deaths caused by congenital anomalies were excluded, the neonatal mortality rates for these groups fell by around half.
Stillbirths
Neonatal deaths
Data sources: MBRRACE-UK, PDS, ONS, NRS, PHS, NIMATS, States of Guernsey, States of Jersey.
Description of Figure 8: Dumbbell charts showing stillbirth and neonatal mortality rates by babies’ ethnicity, for babies born in the UK between 2022 to 2024, presented with and without deaths due to congenital anomalies. Each dumbbell shows the difference in mortality rates when deaths due to congenital anomalies are included or excluded. Rates for babies of Black ethnicity combine several smaller subgroups because the numbers of deaths for babies of Black Caribbean and Other Black ethnicities are too small to report separately. Stillbirth rates are shown per 1,000 total births, and neonatal mortality rates are shown per 1,000 live births. Babies born at less than 24 completed weeks’ gestational age and terminations of pregnancy are excluded. Data for 2022 to 2024 are combined because the number of deaths in some ethnic groups is small, and combining the years makes the rates more reliable.
7. Summary
1. Rates of baby death continued to decrease in 2024
Compared with 2023, stillbirth, neonatal mortality and extended perinatal mortality rates were lower in England and for the UK as a whole. Since MBRRACE-UK began in 2013, the number of babies who died shortly before, during, or soon after birth has been falling across all UK nations. In 2024, the UK extended perinatal mortality rate was 4.77 baby deaths for every 1,000 births, which is 21% lower than in 2013.
2. Stillbirth rates were similar across most trusts and health boards, but neonatal mortality rates varied more
For stillbirths, all trusts and health boards had a stabilised and adjusted stillbirth rate within 5% of the average rate for their comparator group. There was more variation in neonatal mortality rates, with only 24% falling within that range.
3. Most baby deaths occurred before 37 weeks, despite improving outcomes
Over the past five years, rates of baby death have generally fallen, especially for babies born later in pregnancy. There has also been a recent reduction in neonatal mortality rates for babies born at 28 to 31 weeks, following several years of little change. Most stillbirths and neonatal deaths were of babies born before 37 weeks of pregnancy, particularly at the earliest gestations.
4. Inequalities in perinatal mortality remain large despite recent improvements
Differences linked to the level of financial disadvantage in an area (socioeconomic deprivation) continue to be a major concern. Stillbirth rates remain highest among babies born to mothers living in the most deprived areas, although the rate for this group has fallen since 2023. For neonatal mortality, the gap between the most and least deprived areas narrowed slightly after several years of widening. Even so, rates for babies born to mothers who live in the most deprived areas were still much higher than for those in the least deprived areas. This is despite a 14% reduction in neonatal mortality rates for the most deprived group..
5. Ethnic differences in mortality rates continued
Between 2023 and 2024, stillbirth rates continued to fall across all ethnicities, reflecting a longer‑term improvement since 2020. Over the same period, neonatal death rates fell for babies of Asian and White ethnicity but were slightly higher for babies of Black ethnicity. Despite overall progress, babies of Black and Asian ethnicity continue to experience higher mortality rates than babies of White ethnicity.
6. Socioeconomic deprivation affects some ethnic groups more than others
Babies of Asian Bangladeshi, Asian Pakistani and Black ethnicity already have the highest rates of stillbirth and neonatal death when looking at ethnicity alone. These three groups also have a much larger proportion of babies born to mothers living in the most deprived areas. This means that the effects of socioeconomic deprivation add to these already higher rates.
7. The most common causes of baby death were unchanged
The main causes of stillbirth were problems with the placenta, congenital anomalies (health conditions or differences a baby is born with that affect how their body develops or works), infections and issues with the umbilical cord. Neonatal deaths were most often caused by congenital anomalies, problems with the brain or nervous system, extreme prematurity, heart or lung complications, and infections.
8. Congenital anomalies affect mortality rates differently across ethnic groups
Congenital anomalies contributed to baby deaths in every ethnic group, but their impact was not the same for all babies. They had the largest effects on neonatal mortality rates for babies of Asian Bangladeshi, Asian Pakistani and Black ethnicity. When deaths caused by congenital anomalies were excluded, the neonatal mortality rates for these groups fell by around half.
9. What this means
These findings show that progress is being made in reducing baby deaths, but there is still important work to do — especially to tackle the gaps linked to deprivation, ethnicity, and how early in pregnancy a baby is born. We have previously made national recommendations to help with this, but local services, networks, and commissioners may need to take a closer look at their own areas to understand what is happening and take action that works for their communities.
| No. | Previous recommendations that are still relevant |
|---|---|
| P1. | Ensure neonatal intensive care capacity and resources reflect the increase in the numbers of babies born before 24 completed weeks’ gestational age receiving survival-focused care. |
| P2. | Support external clinical input into the rigorous review of all stillbirths and neonatal deaths across the UK, to identify learning and common themes related to clinical care and service provision, delivery and organisation. |
| P3. | Ensure healthcare providers adopt and use the BAPM Perinatal Optimisation Pathway, to improve preterm outcomes. |
| P4. | Continue to develop and implement targeted action, at national and organisational levels, to support the reduction of direct and indirect health inequalities. |
8. Further information
8.1. Supporting materials
Additional supporting materials to accompany this report include reference tables, a data viewer for viewing and and comparing perinatal mortality rates for the organisations responsible for the commissioning and provision of care, and a guide to our methods. You can also download a PDF version of the report.
8.2. Deaths reported to MBRRACE-UK
Since 1 January 2013, we have been collecting information on:
- Late fetal losses: These are babies born at 22 or 23 weeks of pregnancy who show no signs of life, regardless of when they died.
- Stillbirths: These are babies born from 24 weeks of pregnancy (or weighing at least 400g if we don't have an accurate estimate of gestation) who show no signs of life, regardless of when they died.
- Neonatal deaths: This refers to babies born alive who die before they're 28 days old, provided they were born from 20 weeks of pregnancy (or weighed at least 400g if we don't have an accurate estimate of gestation).
We also collect limited information on terminations of pregnancy that result in a registered stillbirth (from 24 weeks) or neonatal death (from 20 weeks). We gather this specific data so we can exclude these cases from our reported statistics on perinatal mortality.
8.3. The birth cohort
We present rates of stillbirth, neonatal death, and extended perinatal death for babies born in England, Wales, Scotland, Northern Ireland, and the Crown Dependencies between 1 January and 31 December 2024. This means that if a baby was born in December 2024 but died in January 2025, that death would be included in the 2024 report. We use this "birth cohort" method for reporting mortality, which is different from official government publications that are based on deaths in a calendar year (a "death cohort"). This method allows us to produce more accurate estimates of mortality rates because we have the correct number of babies born to use as a comparison. Deaths for Guernsey were not included in data for 2022, but are included in previous and subsequent years.
8.4. Data extraction date
The data in this report was extracted from the MBRRACE-UK database on 15 December 2025. Any changes to the database made after this date are not reflected in the report or accompanying reference tables.
8.5. Data sources
The data presented in this report is derived from a number of sources in addition to the information submitted via the MBRRACE-UK web-based reporting system: ONS, PDS, NRS, PHS, NISRA, Health and Social Services Department (Bailiwick of Guernsey), and the Health Intelligence Unit (Bailiwick of Jersey). Full details of all the data sources we use, and how we make sure we have complete data on all births and baby deaths can be found in the guide to our methods.
8.6. Why do MBRRACE-UK statistics on stillbirths and neonatal deaths for England and Wales differ from those published by ONS?
We report on perinatal mortality for the whole of the UK and Crown Dependencies, as well as for each individual nation. The Office for National Statistics (ONS) also publishes annual data on perinatal mortality in England and Wales. ONS figures on perinatal mortality are based on all births and deaths registered via the General Register Office. This includes all stillbirths registered at 24 weeks or more gestation, in line with the Stillbirth (Definition) Act 1992, and neonatal deaths of babies born at any gestational age. Our goal is to publish data on perinatal deaths that are clinically comparable across different organisations, such as healthcare providers or the devolved nations within the UK. Since registered stillbirths and neonatal deaths are affected by some inconsistencies in reporting between organisations, we apply a rigorous definition of deaths to ensure comparability.
There are five key differences in the way MBRRACE-UK and ONS report stillbirths and neonatal deaths:
- We report stillbirths where the birth occurred from 24 completed weeks’, irrespective of when the baby died in utero (including some unregistered deaths), while ONS statistics are based only on registered stillbirths.
- We report neonatal deaths from 24 completed weeks’ gestational age. ONS has no gestational age limit.
- We don’t include deaths following termination of pregnancy, which are included in ONS figures.
- We report deaths by the year of the baby’s birth, while ONS report deaths by the year of the baby’s death.
- We report some rates by place of baby’s birth, and others by place of residence. ONS report deaths by place of residence.
Alongside this summary, we also provide a more detailed explanation of the reasons behind these differences, and their effect on the statistics we publish.
8.7. Funding
The Maternal, Newborn and Infant Clinical Outcome Review Programme, delivered by MBRRACE-UK, is commissioned by the Healthcare Quality Improvement Partnership (HQIP) and funded by NHS England and the Governments of Wales, Northern Ireland, Jersey, Guernsey, Scotland and the Isle of Man as part of the National Clinical Audit and Patient Outcomes Programme.
8.8. Stakeholder involvement
Groups that support parents and families play a vital role in the MBRRACE-UK programme. They're part of a special group called the Third Sector stakeholders. These organisations help us in a few key ways:
- They help us figure out what new research we should focus on in the future.
- They're crucial in sharing our important findings and messages with parents, families, the wider public, and those who make policy decisions. This includes helping us create easy-to-understand summaries of our reports.
There is a full list of organisations in the acknowledgements.
8.9. How to refer to this report
Please use this reference if you mention this report:
Gallimore ID, Matthews RJ, Page GL, Smith LK, Fenton AC, Knight M, Smith PW, Redpath S, Manktelow BN, on behalf of the MBRRACE-UK Collaboration. MBRRACE-UK Perinatal Mortality Surveillance, UK Perinatal Deaths of Babies Born in 2024: State of the Nation Report. Leicester: TIMMS, School of Healthcare, University of Leicester. 2026.
Published by:
TIMMS
School of Healthcare
University of Leicester
George Davies Centre
University Road
Leicester LE1 7RH
9. Version history
| Version | Details of changes | Release date |
|---|---|---|
| 1.0. | First published. | 11 June 2026 |