MBRRACE-UK perinatal mortality surveillance
Understanding how we report on baby deaths in the UK
A guide to our methods
About this guide
Every year MBRRACE-UK collects data on baby deaths in the UK to understand how many babies die and how often it happens. We also look at important risk factors that might help explain why these deaths occur. We then produce a “State of the nation” report which summarises the rates of stillbirth and neonatal deaths for the different nations and organisations planning and delivering maternity and neonatal care in the UK. This helps those planning and delivering healthcare to develop different strategies to prevent baby deaths, based on when and why they happen. Our reports may also be of interest to others concerned about baby loss in the UK—from bereaved parents and advocacy organisations, to families, expectant parents, and the general public.
This guide will help you understand how we collect, analyse, and report on baby deaths in the UK. By providing this clear guide to our methods, we aim to be transparent about our work and help everyone — from parents and families to healthcare professionals and policymakers — understand how we contribute to improving outcomes for babies and their families across the UK.
We use different words to refer to different times when a baby dies:
- A late fetal loss is when a baby is born at 22 to 23 weeks gestational age without any signs of life.
- A stillbirth is when a baby is born at 24 or more weeks gestational age without any signs of life.
- A neonatal death is when a baby is born at any gestational age who lives, even briefly, but dies within 4 weeks of birth.
- Stillbirths and neonatal deaths combined are known as extended perinatal deaths
Gestational age is how far along the pregnancy was when the baby was born. This is measured in completed weeks of pregnancy. We mostly report on deaths of babies born at 24 weeks or later. We mostly report on deaths of babies born at 24 weeks or later. Since babies born before 24 weeks are at much higher risk of dying, we look at them separately to better understand the risks for that group. We also do this to avoid confusion, as clinical practice has varied for babies born before 24 weeks, which has affected whether these deaths were recorded as a neonatal death or a late fetal loss.
The mortality rate is the number of baby deaths compared to the number of births. We calculate separate rates for each type of death and show them as the number of deaths for every 1,000 births. For example, a stillbirth rate of 3.0 means that for every 1,000 babies born, three were stillborn. We do not include terminations of pregnancy in any of the rates we report.
In our reports and the supporting materials we use the words ‘women’ and ‘mothers’. However, we acknowledge that not everyone who uses perinatal services identifies as a woman or mother. Our recommendations apply to all people who are pregnant or have given birth. Similarly, when we say ‘parents’ we mean anyone who has the main responsibility of caring for a baby.
There are other important words which you can hover over or click on to read the definition. You can find a full list of the important words we use, and what they mean, in Section 5. You'll also find a list of all the abbreviations we use, and what they stand for.
1. How we report on baby deaths
1.1. What deaths are reported to us?
Since 1 January 2013, we've been collecting information on:
- Late fetal losses: These are babies born at 22 or 23 weeks of pregnancy who show no signs of life, regardless of when they died.
- Stillbirths: These are babies born from 24 weeks of pregnancy (or weighing at least 400g if we don't have an accurate estimate of gestation) who show no signs of life, regardless of when they died.
- Neonatal deaths: This refers to babies born alive who die before they're 28 days old, provided they were born from 20 weeks of pregnancy (or weighed at least 400g if we don't have an accurate estimate of gestation).
We also collect limited information on terminations of pregnancy that result in a registered stillbirth (from 24 weeks) or neonatal death (from 20 weeks). We gather this specific data so we can exclude these cases from our reported statistics on perinatal mortality.
We want to make sure our data is complete and can be compared internationally. That's why our criteria for inclusion are based on the gestational age when the baby was born, regardless of when the death happened. So, all babies born from 22 completed weeks' gestational age showing no signs of life must be reported to us. For all deaths, if we don't have an accurate estimate of gestation, we use a minimum birthweight of 400g to decide if it's eligible for reporting. For multiple pregnancies (like twins or triplets), if one baby dies in the womb before 20 weeks and there's a long gap before birth, we exclude that death.
We use a secure online reporting system that all UK Trusts and Health Boards providing maternity and neonatal care can access. It's the responsibility of the Trust or Health Board where the death occurred to report it to us and ensure the data is complete and of good quality. Each Trust and Health Board has special "MBRRACE-UK lead reporters" who are our main contacts. To make sure we don't miss any relevant deaths, we also get details of officially registered deaths from bodies like the Office for National Statistics (ONS) in England and Wales, National Records of Scotland (NRS), and others. You can find more details about our reporting system in section 2.
1.2. What information do we collect?
We ask for comprehensive information about each death. This allows us to examine the risk factors for perinatal mortality in the UK in detail. We collect specific data to help us adjust crude mortality rates and to get a clearer understanding of the health, social, and lifestyle factors most often linked to stillbirth or neonatal death. The data we collect for each death includes information about the following:
- Mother's and baby's identifying information: This helps us cross-check each death against other national databases and find any duplicate records.
- Mother's health, lifestyle, and previous pregnancy history.
- Mother's antenatal care (the care she received during pregnancy).
- Details about labour and when the baby was born.
- The cause of death and any results from a post-mortem examination.
You can find more details about the exact data we request for each late fetal loss, stillbirth, and neonatal death in section 4. We've obtained approvals from all relevant authorities to collect identifiable data without consent and to access official birth and death information (see section 2).
1.3. What deaths are included in our reported mortality rates?
Most of our reported mortality rates are based on stillbirths and neonatal deaths of babies born at 24 weeks' gestational age or later. To allow for fairer comparisons between different organisations, we exclude babies born at less than 24 completed weeks' gestational age and pregnancies that ended in a termination, unless we say otherwise. This approach helps us avoid the impact of different ways babies born before 24 weeks are classified (either as a neonatal death or a late miscarriage), and the known variations in the rate of termination of pregnancy for congenital anomalies across the UK. However, since babies born before 24 weeks are at much higher risk of dying, we look at them separately to better understand the risks for that group.
Our mortality rates include deaths due to congenital anomalies, unless we specify otherwise.
1.4. How we define the "birth cohort" for reporting
We present rates of stillbirth, neonatal death, and extended perinatal death for babies born between 1 January and 31 December of a specific year. This means, for example, that if a baby was born in December 2024 but sadly died in January 2025, that death would be included in the 2024 report. We use this "birth cohort" method for reporting mortality, which is different from official government publications that are based on deaths in a calendar year (a "death cohort"). This method allows us to produce more accurate estimates of mortality rates because we have the correct number of babies born to use as a comparison.
To generate mortality rates that are adjusted for factors like the mother's health, the baby's characteristics, and socioeconomic factors, we get individual-level information on all babies born in the UK and Crown Dependencies. We combine information from sources like the Personal Demographics Service (PDS) and ONS birth registration data for England, Wales, and the Isle of Man; National Records Scotland (NRS) and Public Health Scotland (PHS); and others for Northern Ireland and the Crown Dependencies. This creates a single dataset of all babies born for the entire UK and Crown Dependencies. We then combine this birth data with the information on deaths to get the final data for our analysis. You can find more details on how we create this births dataset in section 2.
1.5. Why do MBRRACE-UK statistics on stillbirths and neonatal deaths for England and Wales differ from those published by ONS?
We report on perinatal mortality for the whole of the UK and Crown Dependencies, as well as for each individual nation. The Office for National Statistics (ONS) also publishes annual data on perinatal mortality in England and Wales. ONS figures on perinatal mortality are based on all births and deaths registered via the General Register Office. This includes all stillbirths registered at 24 weeks or more gestation, in line with the Stillbirth (Definition) Act 1992, and neonatal deaths of babies born at any gestational age. Our goal is to publish data on perinatal deaths that are clinically comparable across different organisations, such as healthcare providers or the devolved nations within the UK. Since registered stillbirths and neonatal deaths are affected by some inconsistencies in reporting between organisations, we apply a rigorous definition of deaths to ensure comparability.
There are five key differences in the way MBRRACE-UK and ONS report stillbirths and neonatal deaths:
- We report stillbirths where the birth occurred from 24 completed weeks’, irrespective of when the baby died in utero (including some unregistered deaths), while ONS statistics are based only on registered stillbirths.
- We report neonatal deaths from 24 completed weeks’ gestational age. ONS has no gestational age limit.
- We don’t include deaths following termination of pregnancy, which are included in ONS figures.
- We report deaths by the year of the baby’s birth, while ONS report deaths by the year of the baby’s death.
- We report some rates by place of baby’s birth, and others by place of residence. ONS report deaths by place of residence.
Alongside this summary, we also provide a more detailed explanation of the reasons behind these differences, and their effect on the statistics we publish.
1.6. Organisations we report mortality rates for
We report rates of stillbirth, neonatal death, and extended perinatal death for four groups of clinical and administrative organisations:
-
Organisations responsible for planning and funding healthcare, based on where the mother lived at the time the baby was born:
- England: Integrated Care Boards (ICBs); sub-Integrated Care Board Locations (sub-ICBs);
- Scotland: National and Health Boards;
- Wales: National and Health Boards;
- Northern Ireland: National and Local Commissioning Groups;
- Crown Dependencies: Isle of Man, Bailiwick of Guernsey, and Bailiwick of Jersey.
-
Organisations that provide healthcare services, based on where the baby was born:
- England: NHS Trusts;
- Scotland: Health Boards;
- Wales: Health Boards;
- Northern Ireland: Health and Social Care Trusts;
- Crown Dependencies: Isle of Man, Bailiwick of Guernsey, and Bailiwick of Jersey.
-
UK Neonatal Networks, based on where the baby was born.
-
Local government areas, based on where the mother lived at the time the baby was born:
- England: Single tier authorities, upper tier authorities and London boroughs;
- Scotland: Unitary authorities;
- Wales: Local authorities;
- Northern Ireland: Local government districts;
- Crown Dependencies: Isle of Man, Bailiwick of Guernsey, and Bailiwick of Jersey.
1.7. How we analyse mortality rates
We report three mortality outcomes for each organisation: stillbirth, neonatal death, and extended perinatal death. These mortality rates are presented in a few different ways, depending on the type of organisation: as a ‘crude’ mortality rate, a ‘stabilised’ mortality rate and a ‘stabilised & adjusted’ mortality rate.
The crude rate
The crude mortality rate is simply the number of deaths divided by the total number of babies born (or babies born alive for neonatal mortality) for the reported year. Because there are a lot of babies born each year, we show the mortality rate as the number of deaths per 1,000 births (for neonatal deaths, we use the number of live births). The crude rate gives an annual snapshot of mortality in an organisation.
While the crude rate is informative because it shows exactly what happened for that organisation, it can be misleading when we're trying to highlight organisations where the mortality rate is higher than expected. The number of perinatal deaths for many organisations is likely to be small, as these deaths are rare, and there will be more deaths in some years than in others just by chance. This can lead to big fluctuations in the annual crude mortality rate, especially for organisations with a very small number of babies born.
The stabilised rate
To compare organisations more fairly, we use a special statistical process to stabilise mortality rates. When an organisation has only a small number of babies born, it's hard to be sure in any one year if an extreme crude mortality rate is real or just a random occurrence. Stabilisation helps us get a clearer, more reliable picture of an organisation's mortality rate over time, especially when they have a small number of babies born.
Example: Imagine a very small hospital which only has around 100 babies born each year. If, by chance, they have no deaths in a particular year, their "crude" mortality rate would be 0 per 1,000 babies born. If they had just one death, it would jump to 10 per 1,000 babies born. It's highly unlikely that the true, long-term mortality rate for such a hospital is actually zero (as sadly, deaths are always a possibility) or as high as 10 per 1,000 (which would be much higher than the UK average).
Stabilisation gently "pulls" these very high or very low crude rates closer to the average mortality rate for similar organisations. This helps to smooth out the random year-to-year variations that come from having small numbers. It gives us an estimated rate that's more likely to reflect the organisation's typical experience.For organisations that plan care or run public health programmes (like Integrated Care Boards or Local Authorities), crude and stabilised rates are shown, along with details about the risk factors in their population. This helps them to develop and target interventions.
The stablised & adjusted rate
Organisations that directly provide services, such as NHS Trusts and Health Boards, and Neonatal Networks, sometimes care for more pregnant women with higher health risks or look after babies who are sicker. This might be because they offer specialist services or serve communities with specific social or health challenges. Even with excellent care, this can lead to higher mortality rates. For these organisations we also adjust the rates to account for key factors known to increase the risk of stillbirth or neonatal death, but we can only adjust for factors that are collected for all babies born across the whole UK. These include:
- The mother's age.
- The level of poverty in the area where the mother lives (socioeconomic deprivation).
- The baby's ethnicity.
- The baby's sex.
- Whether the baby is a twin or triplet.
- For neonatal deaths, we also consider how many weeks pregnant the mother was when the baby was born.
Some other factors that might affect outcomes, like whether the mother smokes or her body mass index (BMI), can't be included in our adjustment. This is because we don't have that information for every baby born in the UK.
- Hospital A has a low overall mortality rate.
- Hospital B has a higher overall mortality rate.
At first glance, you might think Hospital A is doing better.
However, when you look closer, you discover:
- Hospital A mainly cares for straightforward pregnancies with no major health complications.
- Hospital B is a specialist hospital that treats many mothers with very serious health issues and babies born extremely prematurely or with complex conditions. These situations naturally carry a much higher risk, no matter how good the care is.
If you just compared their crude mortality rates, it wouldn't be fair. Hospital B's rate is higher because they are dealing with sicker patients from the start, not necessarily because their care is worse.
Adjustment is like levelling the playing field. It's a statistical process where we account for these differences in the patients. We mathematically "adjust" the mortality rates to factor in how many high-risk mothers or babies each hospital cares for.
After adjustment, you might find that:
- Hospital A's adjusted rate remains similar.
- Hospital B's adjusted rate is lower than their crude rate, showing that their crude rate was because they care for mothers and babies with more complex needs.
So, adjustment helps us compare organisations more fairly by taking into account important differences in the risk factors of the patients they look after.
We combine the results of the stabilisation and adjustment to create a stabilised & adjusted mortality rate. Like stabilised rates, the stabilised & adjusted mortality rate will also tend to be closer to the average mortality rate than the crude mortality rate, especially for organisations with a small number of babies born.
Some hospitals care for a higher number of babies born with congenital anomalies which can increase their risk of dying. To show the impact of congenital anomalies on mortality rates, we also calculate mortality rates which don't include these deaths.
Keep in mind that mortality rates show what happened over a period of time, but they may not reflect the quality of care. To understand these numbers properly, it’s important to consider the type of population being cared for and how services are set up in different areas—including things like patient transfers (where patients are moved from one hospital to another, often for more specialised care) and referrals (when a doctor sends a patient to another specialist or service for further assessment or treatment).
1.8. How we measure socioeconomic deprivation
Socioeconomic deprivation means not having enough money, resources, or opportunities to live a full and healthy life, like most other people in society.
It's sometimes referred to as poverty, but it's about more than just being poor. It includes:
- Financial struggles: Not having enough money for basic needs like food, housing, and heating.
- Limited opportunities: Not having access to good education, well-paying jobs, or safe and supportive communities.
- Lack of resources: Missing out on things that help people thrive, like good healthcare, reliable transport, or places to socialise.
Essentially, it's a situation where someone's background and economic circumstances can hold them back from participating fully and equally in society.
For each baby born in the UK, we take the mother's home address (postcode) and then use official government statistics (the Children in Low-Income Families local area statistics) to understand how much hardship or lack of opportunity exists in that particular neighbourhood.
Once we have this deprivation score for the area each mother lives in, we then line up all the mothers from those living in the least deprived areas to those living in the most deprived areas.
Finally, we divide this long line of mothers into five equally sized groups. Each of these groups is called a quintile
- Quintile 1: The 20% of mothers who live in the least deprived areas. These mothers generally benefit from the most advantageous circumstances in their local environment.
- Quintile 2: The next 20% of mothers, who live in areas that are relatively less deprived than average.
- Quintile 3: The middle 20% of mothers, who live in areas with average levels of deprivation.
- Quintile 4: The next 20% of mothers, who live in areas that are quite deprived.
- Quintile 5: The 20% of mothers who live in the most deprived areas. These mothers generally face the toughest challenges due to where they live.
By grouping mothers into these deprivation quintiles, we can compare groups and easily see if there are differences in outcomes (like how many babies die or when they die) between the most deprived areas and the least deprived areas, or any groups in between. This helps us identify inequalities by highlighting the unfair differences that exist due to people's circumstances and where they live. Ultimately, this information helps policymakers and organisations target resources effectively, directing support to the areas and populations that need it most.
1.9. How we identify potentially high and low rates of death
Once we've calculated each organisation's rate, we colour-code them based on how much they are above or below the "average" mortality rate. For organisations based on the mother's home address when the baby was born, and for neonatal networks, this average is the overall mortality rate for the entire UK and the Crown Dependencies.
However, we know that some organisations providing maternity and neonatal services care for pregnant women with higher health risks or look after sicker babies. This means their expected mortality rates will naturally differ. To make comparisons between Trusts and Health Boards fairer, we put them into five comparator groups based on the level of care they provide – for example, whether they have a neonatal intensive care unit (NICU) and how many babies are born there. This is so we aren't comparing Trusts and Health Boards that are really different, such as a Trust with a large city hospital caring for a high number of the smallest and sickest babies and a Trust where there are only a few hundred births each year. We then compare each organisation to the average mortality rate within its specific group. The five comparator groups are:
- Level 3 Neonatal Intensive Care Unit (NICU) and neonatal surgery;
- Level 3 NICU;
- 4,000 or more births per year at 24 weeks or later (no level 3 NICU);
- 2,000-3,999 births per year at 24 weeks or later (no level 3 NICU);
- Under 2,000 births per year at 24 weeks or later (no level 3 NICU).
Organisations are then categorised as having mortality rates that are above, similar to, or below the average for organisations providing similar levels of care. We use different colours in our data viewer and in the reports we issue to Trusts and Health Boards to represent the different categories of mortality rate:
- Blue: more than 15% lower than the average.
- Yellow: more than 5% and up to 15% lower than the average.
- Amber: within 5% of the average.
- Red: more than 5% higher than the average.
We publish all of these rates in our data viewer, as tables, maps, and other charts.
1.10. How we monitor trends in mortality rates
While individual year's mortality rates give us a snapshot, it's important to look at trends over several years. This helps us see if rates are consistently improving, worsening, or staying the same. To understand how mortality rates are changing over time for Trusts and Health Boards, we monitor trends based on specific conditions. The conditions are ranked from highest to lowest importance, and if a rate meets more than one, we use the highest-ranking condition.
Here's how we identify these trends, from highest to lowest importance:
- Consistent decline in category over 3 years: This applies if an organisation's mortality rate category (Blue - Yellow - Amber - Red) shows a steady decline over three consecutive years. For example, if a rate moves from 'Yellow' (lower than average) to 'Amber' (around average), and then to 'Red' (higher than average) over three years.
- Persistent higher rate: This condition is met if an organisation's mortality rate is classified as 'Red' (more than 5% higher than the average for similar organisations) in the latest year, and was also 'Red' in both of the two years before that.
- Significant decline in a single year: This applies if an organisation's mortality rate category declines by at least two levels in the latest year. For example, moving from the 'Blue' category (more than 15% lower than average) to the 'Amber' category (within 5% of the average).
If any of an organisation's stabilised and adjusted mortality rates meets one of these conditions, they are notified so they can investigate and take action. We also share the their details with the relevant national health authority, such as NHS England, The Scottish Government, Welsh Government, or Northern Ireland Public Health.
1.11. What we do when there are few deaths
To avoid revealing information that could potentially identify individuals, we don't publish the crude mortality rate for an organisation when its is based on a very small number of deaths. This is in line with guidance from the ONS and the Government Statistical Service. These 'suppressed' mortality rates are shown in the data viewer as a white dot on the maps and charts and as -1 in the downloadable data tables.
1.12. Real-time data monitoring for Trusts and Health Boards
Why organisations need real-time data
Annual mortality rates provide a retrospective snapshot — offering a broad view of trends over time and how one organisation compares with another. However, annual rates do not capture what is happening right now within a trust or health board. Our real-time data monitoring (RTDM) fills this gap by providing live and customisable monitoring, using data from all deaths notified to MBRRACE-UK where the trust or health board was the place of birth or death.
How RTDM works
RTDM is based around a type of line chart (a run chart). On this chart each point represents a death, and it is plotted by the date it occurred and the number of days since the previous death.
This visualisation helps teams understand how frequently deaths are occurring and whether trends are improving or deteriorating. Longer gaps between deaths suggest improvement, whereas shorter gaps could indicate a concerning pattern that requires further investigation.
Understanding expected vs. unusual changes
Humans are not naturally skilled at detecting patterns in data; we can often see patterns where none exist or miss subtle, meaningful trends. RTDM helps overcome this by establishing a baseline using historical data and flagging unusual deviations.
To figure out what is unusual, RTDM looks at the typical number of days between deaths over a certain period. It then uses statistical rules to decide whether changes in the frequency of deaths are expected (called common cause variation) or if something unusual might be happening (called special cause variation).
A key part of this is looking for runs — a sequence of points that all fall on the same side of the median.
- If there are six or more deaths in a row happening less often than usual (more days between them), it suggests improvement and they are marked with a blue dot ●
- If six or more happen deaths more often than usual (fewer days between them), it may signal concern and they are marked with an orange dot ●
The system also checks for trends and patterns that are too random or too consistent. These rules help RTDM detect real changes while avoiding too many false alarms.
Turning data into action
When an orange alert appears, it is not a confirmation of a problem — it is a prompt for further investigation. If RTDM signals a possible cluster of deaths, the trust or health board should:
- Carry out a thorough review, including using the Perinatal Mortality Review Tool (PMRT) to review each death, looking at the characteristics of all the mothers and babies, and considering what was happening in the hospital at the time.
- Implement any necessary changes to clinical practice or systems based on the review findings.
- Monitor outcomes over time to assess whether the changes have led to improvement.
When positive changes are sustained, a new RTDM baseline can be established for ongoing comparisons.
Accessing the tool
Because the tool gives the user access to confidential information, access is restricted to authorised users at Trusts and Health Boards. RTDM is available to all registered users of the MBRRACE-UK perinatal surveillance reporting system. Perinatal care professionals who are not yet registered can find details on how to register on the MBRRACE-UK website.
2. How we collect data
2.1 Approvals for collection of patient identifiable data
We need special approvals to collect patient identifiable data and access information from statutory organisations without consent. We need different approvals for each country of the UK:
England and Wales
- The Confidentiality Advisory Group of the Health Research Authority: ECC 5-05 (f)/2012 (from 10 October 2012); 15/CAG/0119 (from 1 May 2015)
- Health & Social Care Information Centre, Data Access Advisory Group: IC604DS
Scotland
- The NHS Scotland Caldicott Guardian: 2014-62 MBRRACE-UK Programme – Update (2013-05)
- The Privacy Advisory Committee, ISD, NHS National Services Scotland: PAC16/14
Northern Ireland
Due to the different data privacy arrangements in Northern Ireland, only de-identified data is provided to the MNI-CORP programme. This data is supplied by the NIMACH office.
2.2. How data is submitted to us
Security
We take security very seriously. When someone accesses the MBRRACE-UK website, they do so over a secure internet connection. Our website and the computers that store our information are kept in a very secure data centre with strong protection against unauthorised access.
Getting online access
To get online access, staff must be approved by their NHS Trust or Health Board, and they can only log in using an NHS or UK university email address. The first time an approved reporter uses the website, they'll need to ask for a special activation code. This code works like a one-time password that they must change immediately. All passwords have to meet strict rules to make sure they're very strong. Every 24 hours, users must also enter a special code sent to their registered email address.
Each reporter is given specific access rights, meaning they can only see the parts of the website that are relevant to their job. For example, some might only report deaths, others might review deaths using a special tool (the Perinatal Mortality Review Tool, or PMRT), and some might access anonymised (non-identifiable) medical notes for our confidential enquries.
All personal details, like patient names, are scrambled (encrypted) before they are stored. We only allow access to identifiable data in very rare and specific situations. Reporters can view data from their own Trust or Health Board (with a valid password), and MBRRACE-UK staff can only access identifiable data if they follow strict NHS rules on information governance, security, and confidentiality.
Making sure data is correct
When reporters want to add a new death or change an existing record, they have to confirm the mother's details (like NHS number, name, and date of birth) every time. We use a national system to check NHS numbers to make sure only valid ones are entered.
Where necessary, the information entered is checked against a range of acceptable values as it's being typed in. If a value is outside what we'd normally expect, the reporter gets a warning. If it's completely outside the allowed range, it can't be entered, and the record can't be finished. Before a record can be completed, we do extra checks; for example, we check all the dates in the record against each other to make sure they make sense.
Sometimes, a few pieces of information might not be available. In these cases, reporters can mark the item as 'not known' and add the missing data later if it becomes available.
For many deaths, some of the required information might be held in different hospitals. For example, some details about the mother might be with another hospital if the baby was moved after birth. If the extra information is at a different site within the same Trust or Health Board, reporters can work with their colleagues (like obstetricians or midwives) to get it. However, if the information is held by a different Trust or Health Board, our system allows the reporter to temporarily pass ownership of that MBRRACE-UK record to the other Trust or Health Board. They can then add the missing details and send it back to the original reporter.
Online help
On every screen where users enter data, many of the fields have a 'Help' icon they can click for specific guidance. Also, every screen has a way for users to send a help request. This goes straight to the MBRRACE-UK office by email, and the appropriate technical, clinical, or administrative staff will help. Users can also download a detailed user manual from our system.
Reports
The MBRRACE-UK online reporting system allows reporters access to information relating to deaths at their Trust or Health Board:
- The Trust/Health Board case summary list gives brief details of all deaths reported for a specific birth year.
- The Trust/Health Board reported cases list provides short details of all deaths that have been reported.
- The Trust/Health Board summary shows the number of deaths by year, type of case, and unit.
- The Trust/Health Board case review list allows local reporters to check that the data their organisation reported is accurate.
In addition, users can access real-time data monitoring which allows them to view, filter and summarise live data.
2.3. Ensuring all births and extended perinatal deaths are identified
Data sources
To ensure we have complete data on all births and baby deaths, we use multiple data sources and methods to identify any missing cases. We use different sources of data for each of the countries of the UK and the Crown Dependencies:
England and Wales
- Birth registration data – ONS
- Death registration data – ONS
- PDS data on all births – NHS Digital (PDS)
Scotland
- Birth registration data – NRS
- Death registration data – NRS
- Maternity Inpatient and Day Case Dataset (SMR02) inpatient data - PHS, NHS National Statistics Scotland
Northern Ireland
- Birth registration data - NIMACH, Health and Social Care Public Health Agency – derived from NIMATS
- Death registration data - NIMACH, Health and Social Care Public Health Agency – derived from NIMATS
- Inpatient data - NIMACH, Health and Social Care Public Health Agency – derived from NIMATS
Crown Dependencies
- Birth registration data - Health and Social Services Department, States of Guernsey
- Death registration data - Health and Social Services Department, States of Guernsey
- Birth registration data - Health Intelligence Unit, Public Health Services, States of Jersey
- Death registration data - Health Intelligence Unit, Public Health Services, States of Jersey
- PDS data on all births, Isle of Man – NHS Digital (PDS)
Identifying all baby deaths
To make sure we know about every stillbirth and neonatal death, we compare the deaths officially registered with the government (such as the ONS) against the deaths that hospitals and health boards have reported directly to us. In Northern Ireland, staff there help us ensure they've reported all their data.
For England, Wales, and Scotland, we use a combination of simple and more complex computer matching techniques. We look at details like the mother's name, address, the hospital where the baby was born, the baby's NHS or CHI number (where available), the baby's gestational age and birthweight, and the dates of birth and death.
Once our checks are finished, we tell our Lead Reporters at each Trust or Health Board about any deaths that occurred in their area but weren't in our system. We then ask them to confirm these deaths and provide the missing information.
We can only start these checks once we receive the official death registration data from government bodies like ONS and NRS. This means we often can't tell our Lead Reporters about missing deaths until several months after they've happened. While most missing deaths can be found this way, some types of deaths that should be reported to us aren't always available promptly from official sources:
- A small number of officially registered deaths are only registered much later, usually because an inquest was taking place.
- Late fetal losses, where babies are born at 22 or 23 completed weeks' gestation, aren't officially registered.
- Guidance from the Royal College of Obstetricians and Gynaecologists (RCOG) states that stillbirths where the baby was born at 24 completed weeks' gestation or more, but the death was confirmed before 24 weeks, shouldn't be officially registered as stillbirths. However, to help us understand variations in how stillbirths around 24 weeks are reported, we ask that all these deaths are reported to MBRRACE-UK.
There aren't any quick and easy ways to get data for deaths that haven't been officially registered. Because of this, we can't guarantee that absolutely all of these unregistered deaths have been reported to MBRRACE-UK.
Identifying all babies born
We collect individual information on all babies born in the UK and Crown Dependencies. We do this to calculate our mortality rates, which are adjusted for factors related to the mother, the baby, and the area they live in. We combine data from various sources across England, Wales, Isle of Man, Scotland, Northern Ireland, Guernsey, and Jersey into one large dataset of all babies born. This combined birth data is then linked with the death information to create the final dataset for our analysis.
It can be tricky to assign babies born to the correct organisation because of how birth locations are recorded. It's not always easy to figure out where a baby was born from the reported data. Often, this requires us to make further detailed enquiries or correct the recorded place of birth if it was accidentally entered incorrectly. It's really important that birth information is complete and accurate, as this allows MBRRACE-UK to link babies born to the right Trust or Health Board for our analysis and reports.
For home births, if recorded, we assign them to the Trust or Health Board responsible for that service. This helps us calculate the correct number of babies born for each organisation.
2.4. How we create the dataset of babies born
We combine all the information we collect on babies born and extended perinatal deaths to create one complete dataset for our analysis. Because the data sources vary slightly between the different countries in the UK, we do this process separately for each country's data first. Once we have each country's dataset, we then combine them all into one final, single dataset for our full analysis.
England and Wales
For England and Wales, we create our complete dataset of babies born and extended perinatal deaths using birth registration data from the Office for National Statistics (ONS), death registration data from ONS, Personal Demographics Service (PDS) records, and our own MBRRACE-UK death notification records. Here's how we do it:
- Restrict to relevant year: We make sure all our datasets only include babies born in the year we're reporting on.
- Combine birth records: We combine all records of babies born into one single dataset (as shown in Figure 1). This includes live birth and stillbirth registrations from ONS, PDS birth records, and MBRRACE-UK notifications of late fetal losses. We use all these different sources to make sure we've captured every baby born in England and Wales.
- Remove ineligible births: We remove babies born before 22 completed weeks' gestational age, and pregnancies that ended in a termination, because these are not included in our reports.
- Remove 22–23 week births For most of the rates we report, we also remove babies born at 22 to 23 completed weeks' gestational age. We report these births separately.
- Combine death records: We combine all records of late fetal losses, stillbirths, and neonatal deaths into a single dataset (as shown in Figure 2). This includes death registrations from ONS, PDS death records, and MBRRACE-UK death notifications. This gives us a complete dataset of extended perinatal deaths for babies born in England and Wales.
- Remove ineligible deaths: We remove any deaths where the baby was born before 22 completed weeks' gestational age, and any pregnancies that ended in a termination, as these aren't included in our reports.
- Remove deaths of babies born before 24 weeks: For most of the rates we report, we also remove deaths where the baby was born before 24 completed weeks' gestational age. We report the deaths of babies born at 22 to 23 weeks of pregancy separately.
- Merge births and deaths datasets: Finally, we combine this comprehensive dataset of deaths with our dataset of babies born to create one complete dataset ready for analysis.
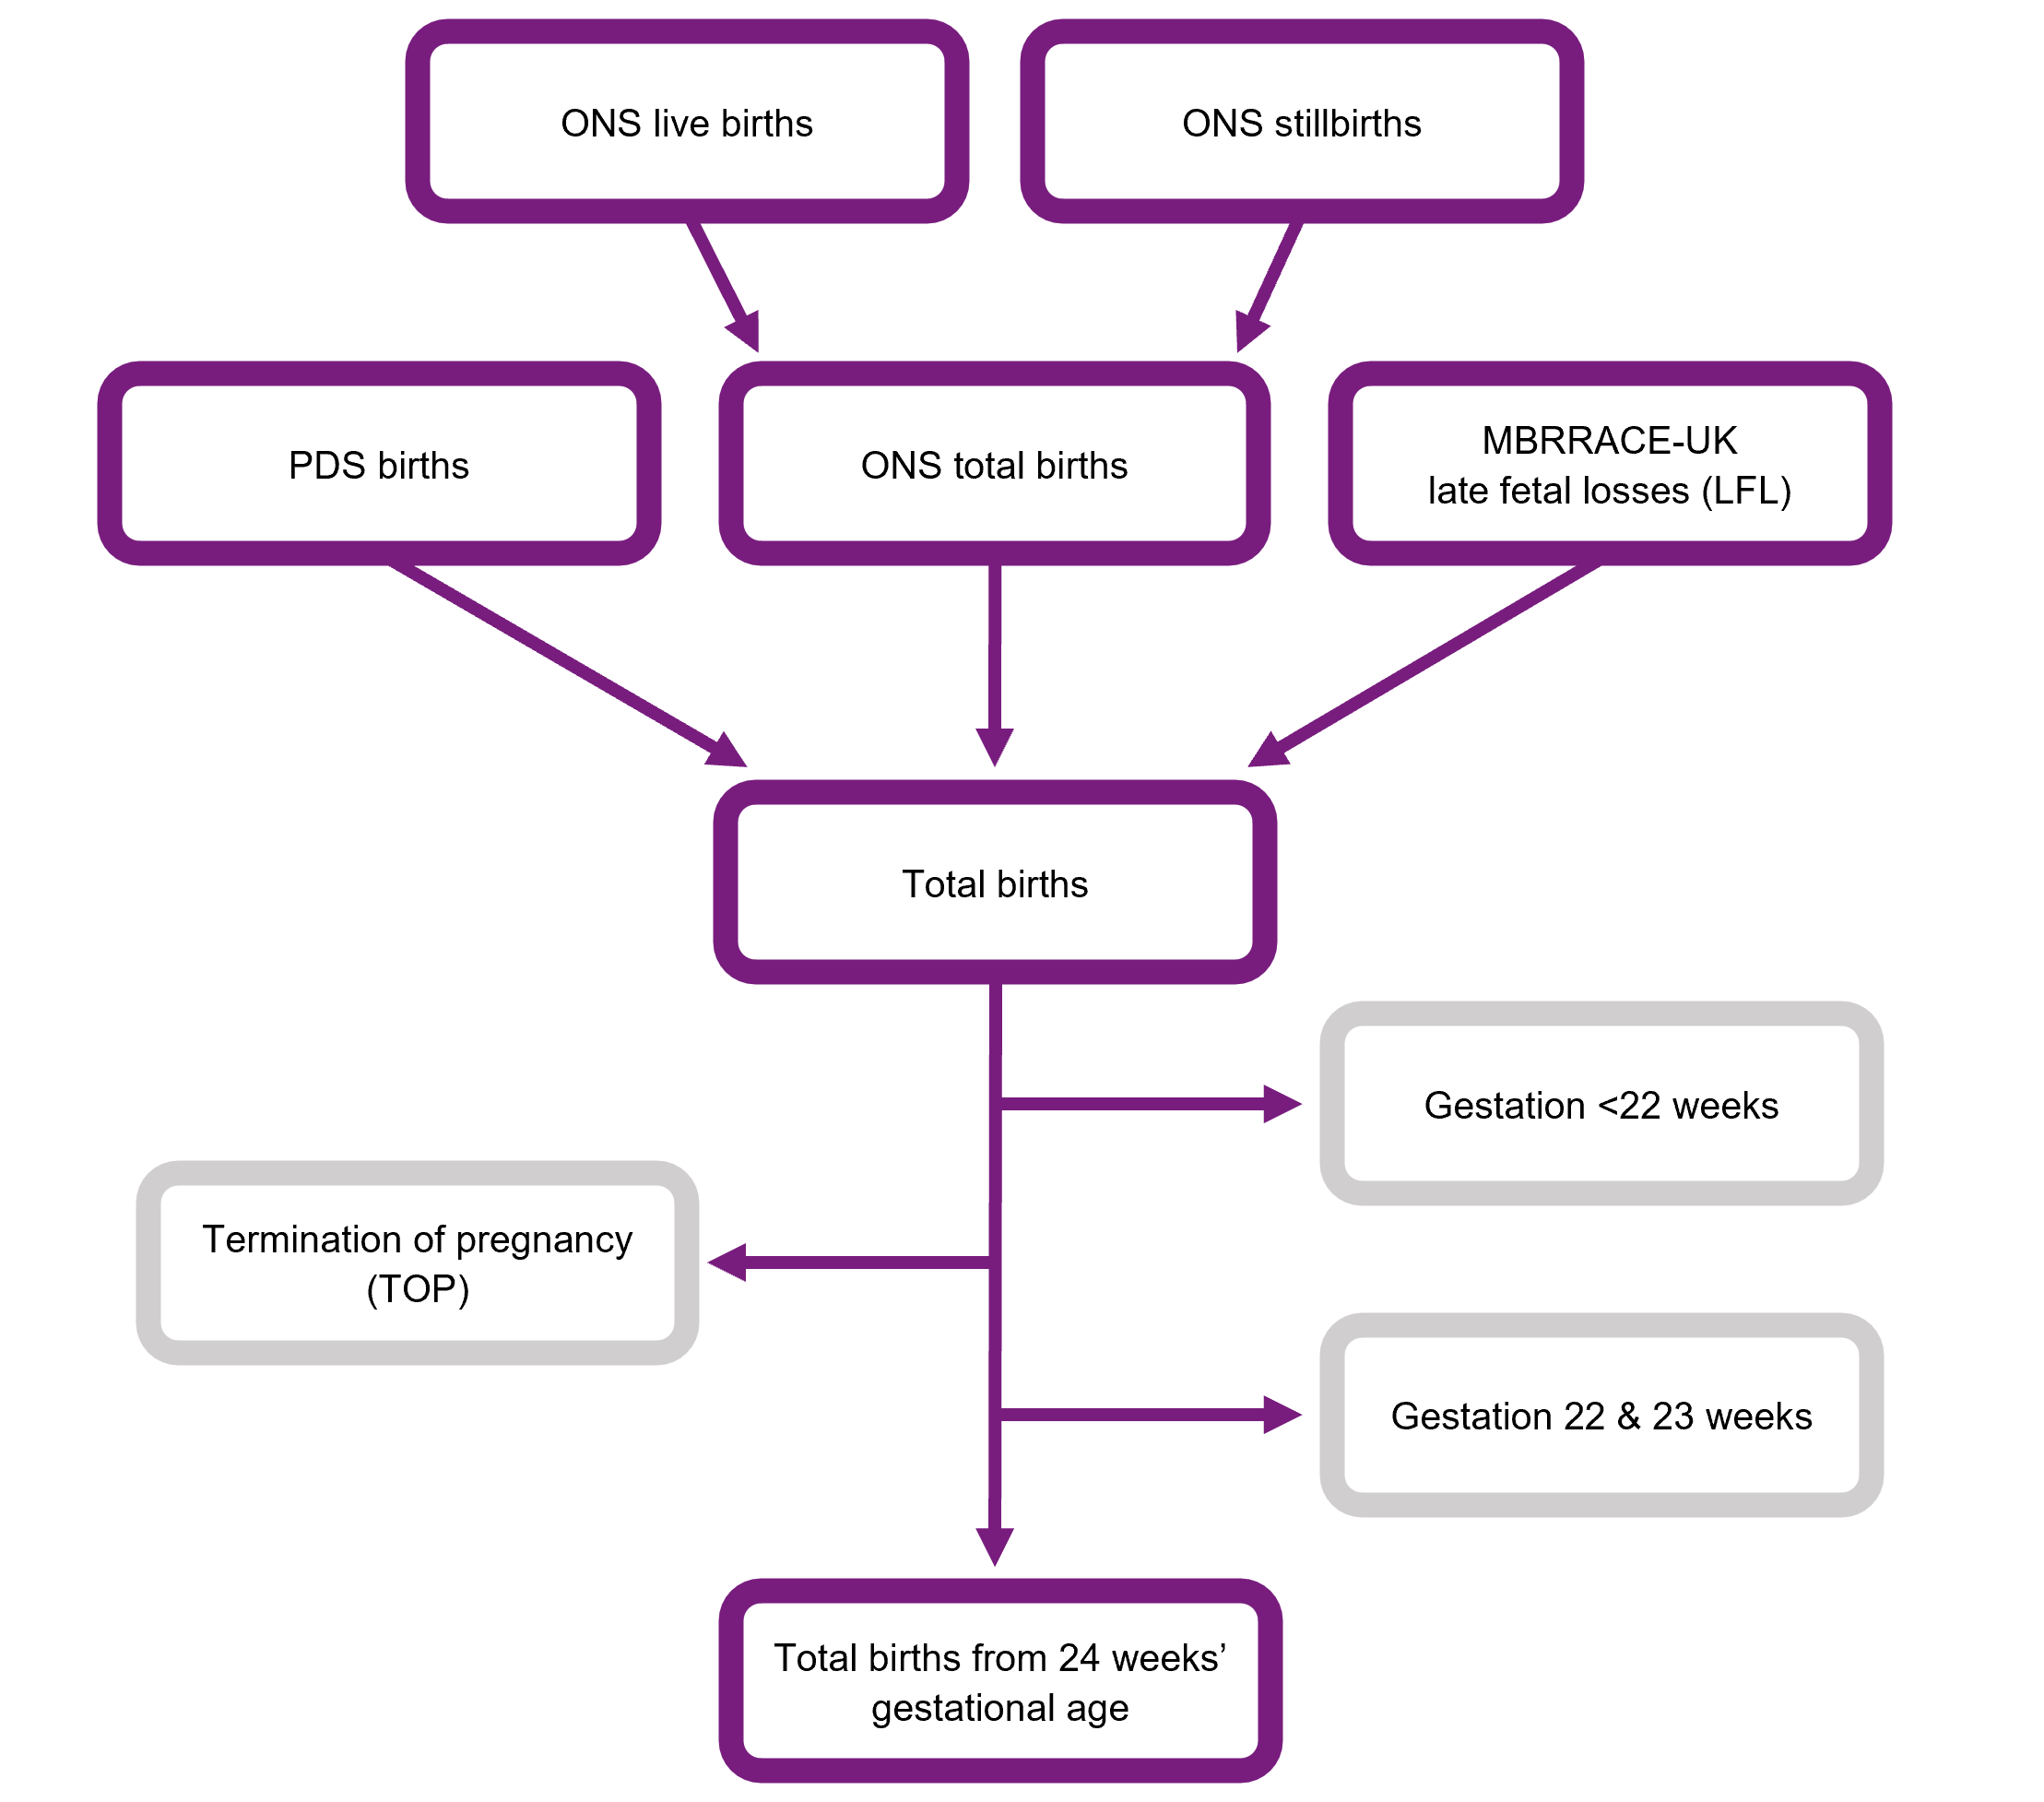
Description of Figure 1: Flow chart showing how datasets from multiple sources are combined in order to generate a complete births dataset for England and Wales.

Description of Figure 2: Flow chart showing how datasets from multiple sources are combined in order to generate a complete extended perinatal deaths dataset for England and Wales.
Scotland
Creating the complete dataset of babies born and extended perinatal deaths for Scotland follows a similar process to England and Wales. The main difference is that for Scotland, we get our data from National Records of Scotland (NRS) (for birth and death registrations), Public Health Scotland (PHS) (specifically, SMR02 Maternity Inpatient and Day Care Case records), and our own MBRRACE-UK death notifications. PHS actually combines the birth registration data and the SMR02 data before sending it to us.
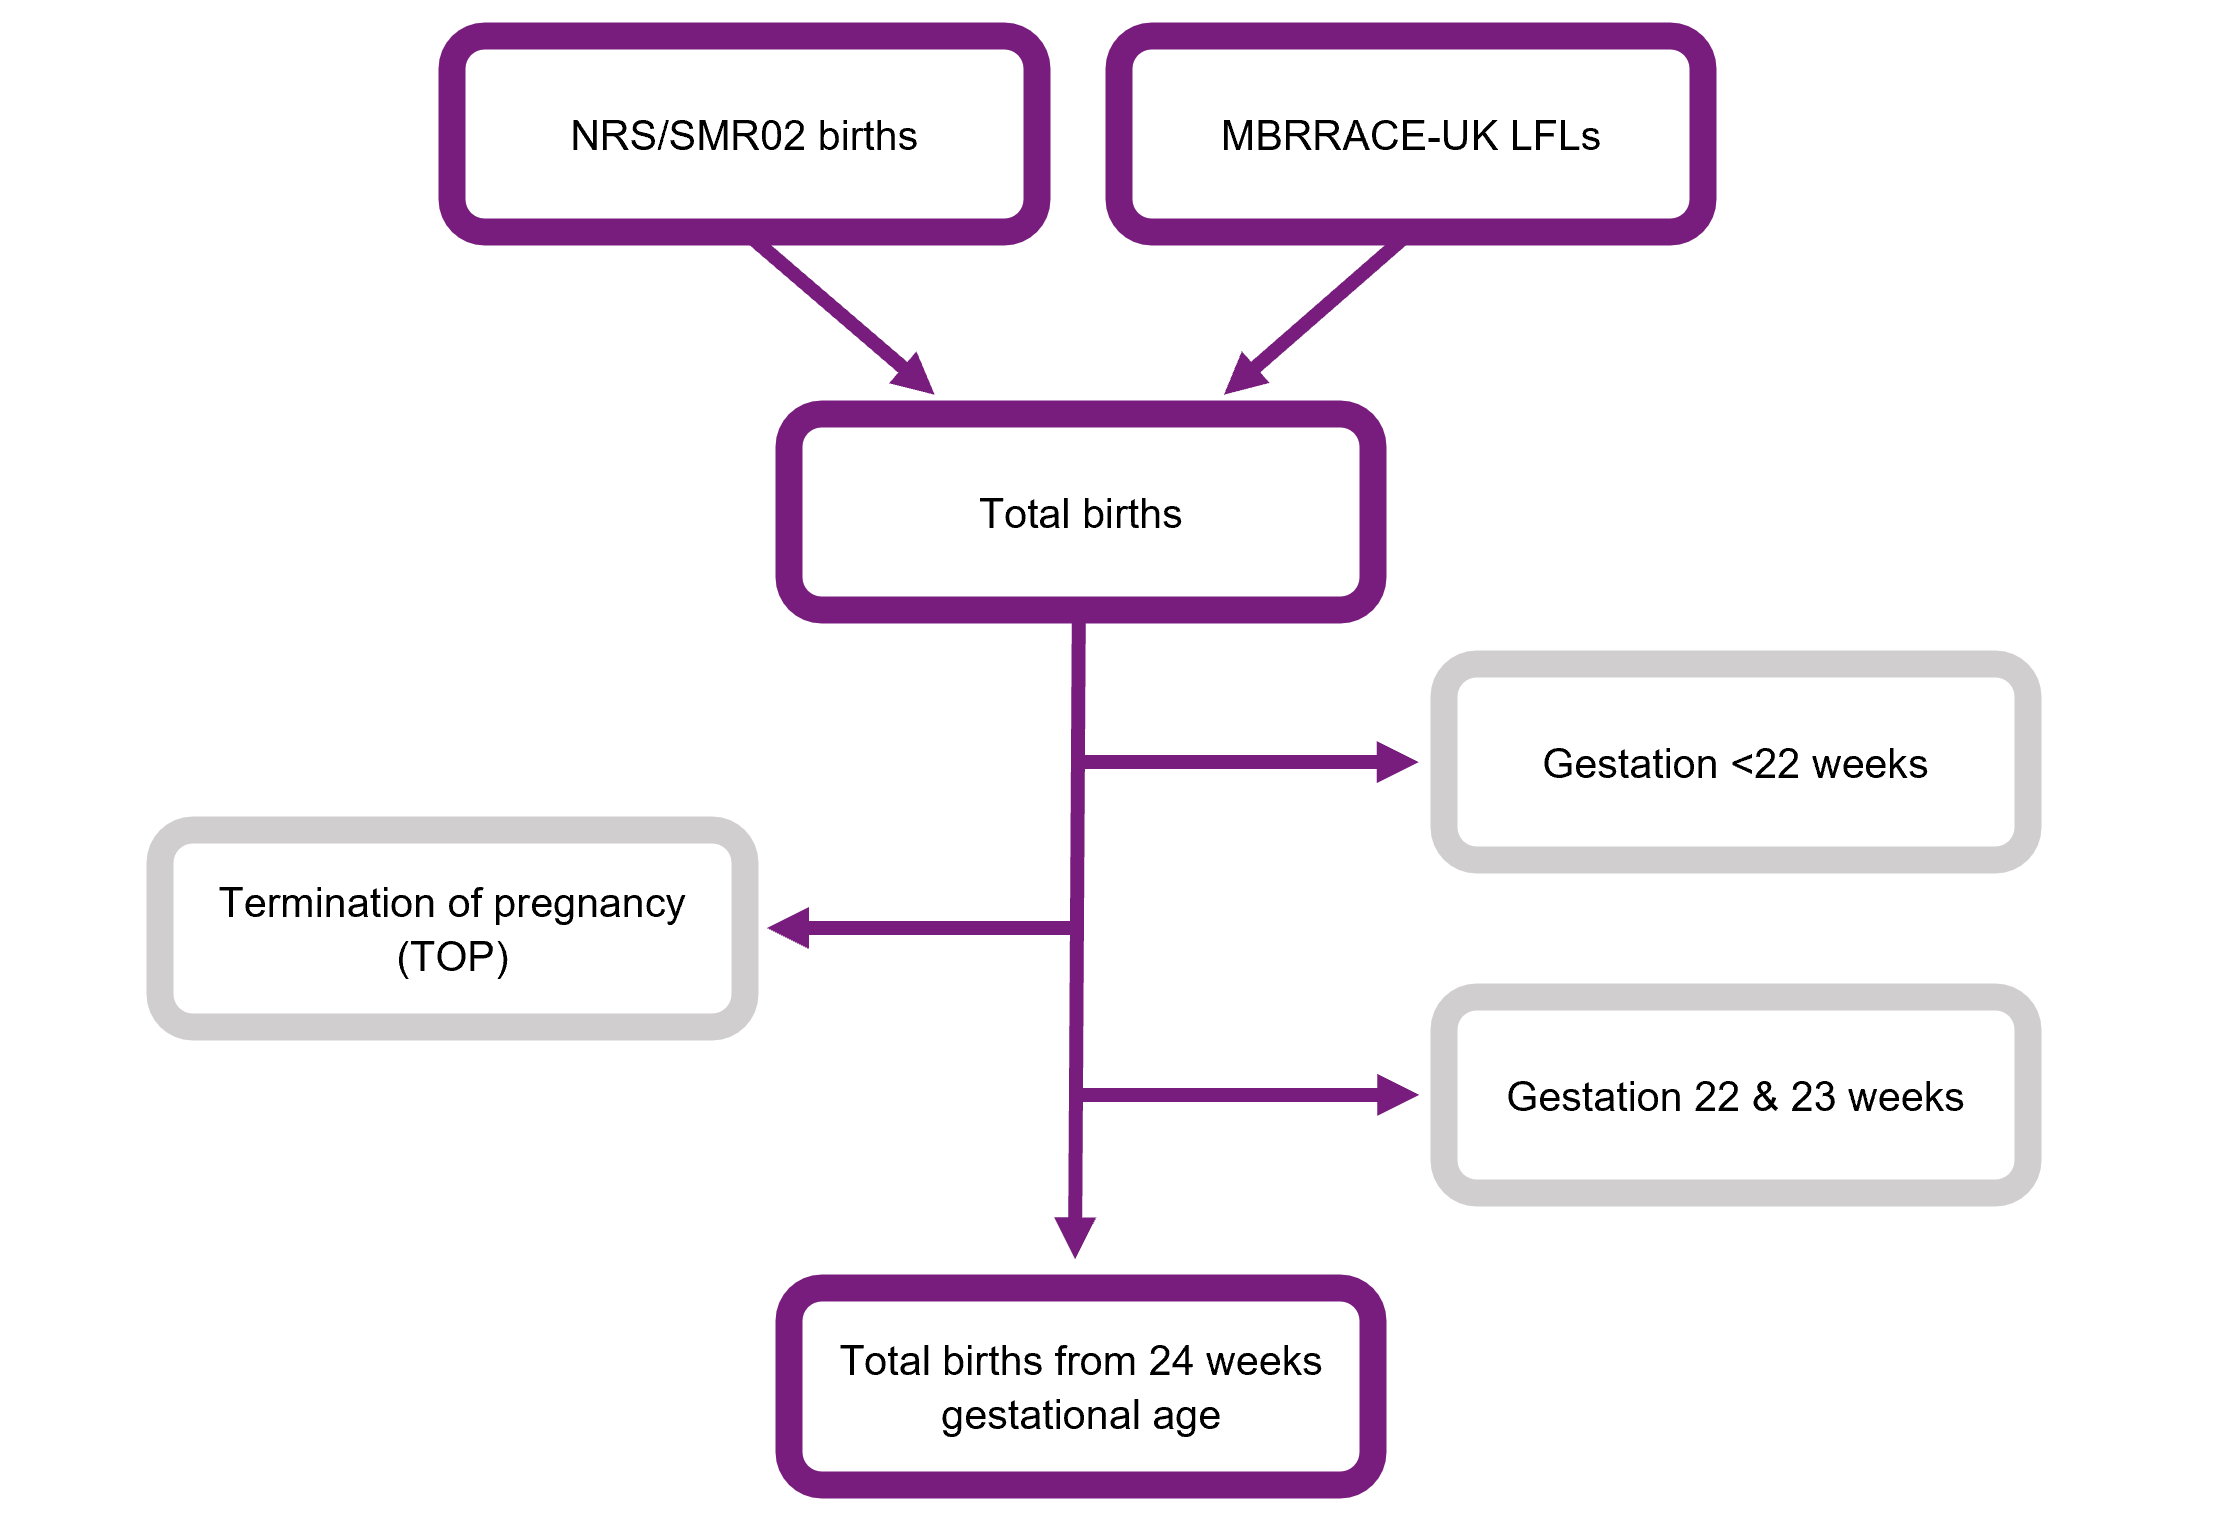
Description of Figure 3: Flow chart showing how datasets from multiple sources are combined in order to generate a complete births dataset for Scotland.
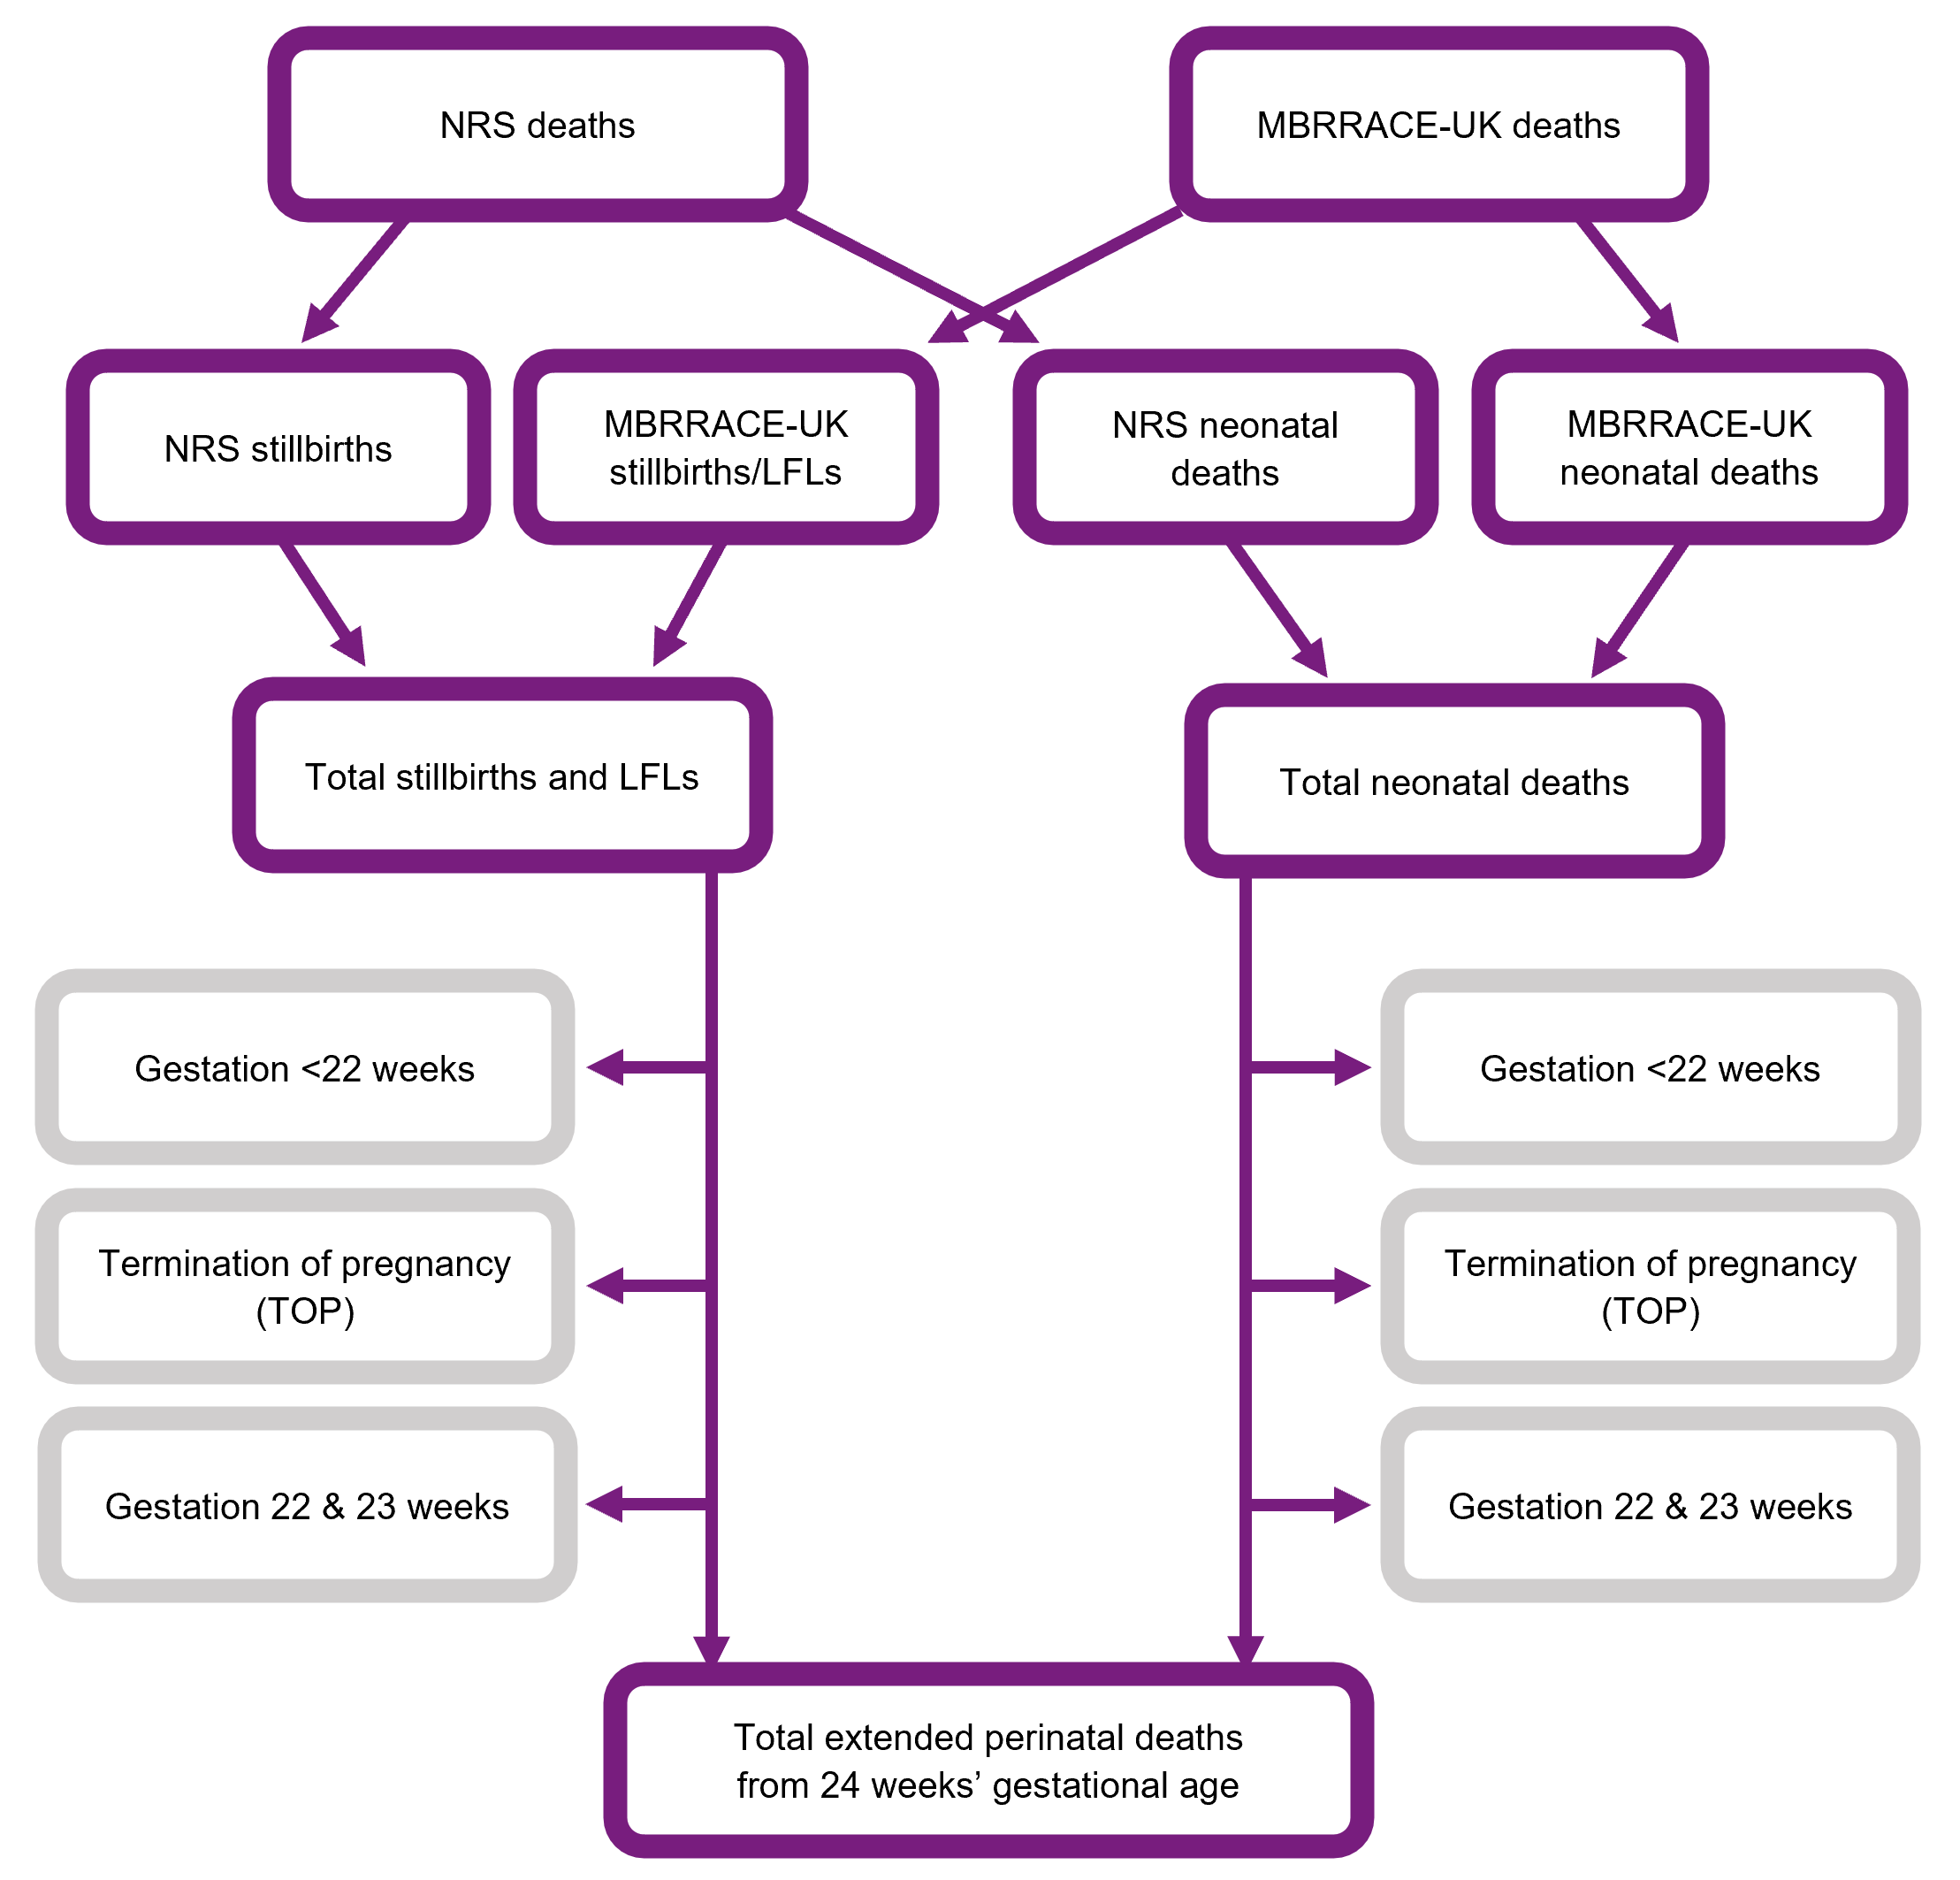
Description of Figure 4: Flow chart showing how datasets from multiple sources are combined in order to generate a complete extended perinatal deaths dataset for Scotland.
Northern Ireland and the Crown Dependencies
For Northern Ireland, the Bailiwick of Guernsey, and the Bailiwick of Jersey, the complete datasets of babies born and extended perinatal deaths are sent directly to us by their national data providers. For the Isle of Man, we get the birth records from the Personal Demographics Service (PDS). In all these cases, we then link these birth and death records to our own MBRRACE-UK records.
Cleaning and linking data, and creating new variables
Sometimes, we get the same piece of information from more than one source. When this happens, we use a "best value" method to decide which piece of information to include in our analysis. This method prioritises the information as follows:
- If available, we use the information recorded in the MBRRACE-UK death record first, as this is our primary source.
- If that information isn't available (for example, if the baby survived the neonatal period), we then use the information from the official birth or death registration record as our secondary source.
- For England and Wales, if neither of those sources has the information, we use the value recorded in the PDS record as our third source.
2.5. Where the mother lived
We use the postcode of where the mother lived when her baby was born to identify the country, as well as specific health organisations like Integrated Care Boards (ICBs) in England, Health Boards in Scotland and Wales, and Health and Social Care Trusts in Northern Ireland. This also helps us identify the relevant Crown Dependency and Local Authority. We need this information to accurately calculate death rates for these different types of organisations. We also use the postcode to work out the level of poverty in the area where the mother lived.
The NHS Trust or Health Board where the baby was born is worked out using the best information available from all our datasets. For England and Wales, we primarily use a code in the ONS birth records that tells us the place of birth. If we can't find the birth location from ONS records (for example, for home births or babies born on the way to hospital), we get the location from the PDS record. If neither of those records clearly tells us the Trust or Health Board of birth, we estimate it based on the postcode where the baby was born.
The NHS Trust or Health Board where the baby died is taken directly from the MBRRACE-UK death record.
2.6. How we classify cause of death
We classify both the main reason a baby died, and up to two other related health conditions that might have played a role, using the Cause of Death & Associated Conditions (CODAC) classification system. The CODAC system has three levels:
- Level 1 is the broadest category, like a major heading (e.g., "Infection" or "Congenital Anomaly").
- Level 2 breaks down those broad categories into more specific sub-types (e.g., within "Infection," you might have "Bacterial Infection").
- Level 3 provides even finer detail, getting very specific about the exact cause (e.g., within "Bacterial Infection," you might have a specific type of bacteria).
This layered approach helps us record both the overall reason for the death and more precise details about what happened. Most of the time we report stillbirths using Level 1, and neonatal deaths using Level 2, because the numbers of each Level 3 cause are often very small.
When reporters use our MBRRACE-UK data entry system, they're asked to provide both a primary cause of death and up to two associated conditions. Following a detailed review of how deaths reported as due to congenital anomalies were coded in our 2015 report, we now present all cause of death data using a congenital anomaly as the cause of death whenever a congenital anomaly is coded as either the primary cause or an associated condition.
3. Our statistical methods
This section explains the special statistical methods we use to work out the different "stabilised & adjusted" mortality rates and how we handle any missing information in our data. Because calculating the different rates is a complicated process, describing it means we have to use some special terms that aren't very easy to understand if you're not an expert. To make it easier to understand what we do, here is a short summary of the process which uses simpler, straightforward language.
- Calculate "stabilised & adjusted" mortality rates for each organisation: We do this by comparing the actual number of baby deaths to the number we'd expect to see if that organisation's patients were typical for the UK, after accounting for certain things we know increase the risk of a baby dying. This helps us create fairer comparisons and avoids wrongly highlighting organisations as outliers just due to chance or their specific patient mix
- Use separate models: We use two separate statistical models to calculate the stabilised & adjusted mortality rates, one for stillbirths and one for neonatal deaths. Each model predicts the likelihood of stillbirth or neonatal death compared to surviving at least 28 days. The results from these models are then used to calculate whether an organisation has more or fewer deaths than expected for stillbirths, neonatal deaths, and a combination of both (extended perinatal deaths).
- Adjust for risk factors: To make fairer comparisons, the model adjusts for important risk factors known to influence a baby's health or survival, such as the mother's age, socioeconomic status, the baby's ethnicity, whether the baby is a twin or triplet, and how far along in pregnancy the baby was born (which is important for neonatal deaths). We can use these factors as they are routinely collected for all births in the UK.
- Account for uncertainty: Because we don’t know the exact mortality rate, we use confidence intervals to show how close our estimate might be to the real rate. The confidence interval gives you a range - from a low number to a high number - and the true rate is very likely to sit somewhere in between. A narrow confidence interval means we can be more certain that the reported mortality rate is accurate, while a wide confidence interval means there is more uncertainty.
- Identify potential outliers: In addition to providing confidence intervals for our mortality rate estimates, our statistical framework also allows us to assess the probability of an organisation's mortality rate falling outside a predefined acceptable range. If the probability is greater than 0.5, it means it is more likely than not that the organisation's rate is outside the expected range.
- Handle missing data: Missing data can affect the accuracy of the mortality rates, so we use a method to estimate what the missing values might be based on the information we do have.
3.1 Calculation of stabilised & adjusted mortality rates
The stabilised & adjusted mortality rate for each organisation (mj) is calculated by multiplying the appropriate 'comparator' mortality rate (M) by an organisation-specific standardised mortality ratio (SMRj) calculated from the data, i.e.:
where
mj is the estimated stabilised & adjusted mortality rate for organisation j
M is the appropriate comparator mortality rate
SMRj is the estimated SMR for organisation j:
Currently, for all organisations, except for the Trusts and Health Boards of birth, the comparator mortality rate is the overall mortality rate for the whole of the UK and Crown Dependencies. For the Trusts and Health Boards of birth the comparator mortality rate is the overall rate for Trusts and Health Boards in the same comparator group (described below).
The SMR is estimated using a multilevel logistic regression model. A multilevel model is used as it can accommodate the hierarchical structure of the data through the random term; that is, births clustered within organisations. These models also allow the calculation of stabilised (also known as ‘shrunken’ or ‘smoothed’) estimates of the organisation-specific terms, which reduce the likelihood of organisations being falsely identified as outliers by chance alone.
Various approaches to calculating a SMR from a multilevel logistic model have been proposed. The method used for the MBRRACE-UK report “… is determined by dividing the smoothed, risk-adjusted, provider-specific estimate of mortality by the estimate of expected mortality obtained using the average intercept for all … providers”. In this approach, the observed number of deaths is replaced by a model-based predicted number reflecting sampling variation in the observed deaths; that is, a stabilised observed number of deaths is estimated for each organisation. Hence, the SMR is the ratio of the stabilised number of deaths to the deaths that would be expected if the organisation’s patients were from an ‘average’ organisation.
3.2. Statistical models
Two multilevel logistic regression models are used, one for the stillbirths as outcome and the other model for neonatal deaths. The reference group for the both models is the births surviving at least 28 days from birth. The multilevel logistic regression model for stillbirth compared to survival to the end of the neonatal period is:
where
Y(SB)ij is the indicator variable of stillbirth for the ith baby in the jth organisation:
Y(SB)ij = 1 if stillbirth; 0 if survivor to end of neonatal period; missing if neonatal death;
xij is the vector of risk-adjustment factors for the ith baby in the jth organisation
zij is the vector of risk-adjustment factors for the jth organisation
δ(SB)j is the random term representing organisation j: δ ~ Normal(0,σ2)
A similar model is estimated for neonatal deaths compared to survival to the end of the neonatal period:
where
Y(NND)ij is the indicator variable of neonatal death for the ith baby in the jth organisation:
Y(NND)ij = 1 if neonatal death; 0 if survivor to end of neonatal period; missing if stillbirth;
xij is the vector of risk-adjustment factors for the ith baby in the jth organisation
zij is the vector of risk-adjustment factors for the jth organisation
δ(NND)j is the random term representing organisation j: δ ~ Normal(0,σ2)
The SMR for stillbirth is then given by combining these two models:
The SMR for neonatal deaths is derived directly from the second multilevel logistic regression model, since stillbirths are not included in the calculation of neonatal mortality rates:
The SMR for the extended perinatal deaths is obtained by combining the results of both models:
3.3. Risk-adjustment factors
For service delivery organisations the multilevel logistic regression model outlined in the previous section includes patient-level and organisation–level factors to adjust for differences in key factors which are known to increase the risk of stillbirth and neonatal mortality. The factors which can be included in the model are limited to those that are routinely collected for all births across the whole UK. For this report the patient-level risk-adjustment factors included in the statistical model were:
- mother’s age (under 20 years, 20 to 24 years, 25 to 29 years, 30 to 34 years, 35 to 39 years, 40 years or older);
- child poverty (measured by the Children in low-income families local measure (for births until 2022) and the Children in low income families: local area statistics (for births from 2023 onwards) based on mother’s residence (quintiles with approximately equal number of total births));
- baby’s ethnicity (White, mixed or multiple ethnicity, Asian or Asian British, Black or Black British, other);
- baby’s sex (male, non-male);
- multiple birth (singleton, multiple);
- interaction between child poverty and baby’s ethnicity;
- interaction between child poverty and mother’s age;
- gestational age at birth for neonatal mortality rates only (24 to 27 completed weeks, 28 to 31 completed weeks, 32 to 33 completed weeks, 34 to 36 completed weeks, 37 to 41 completed weeks, 42 completed weeks or greater).
The only organisation-level factor (zij) currently included in the MBRRACE-UK analysis is a marker for the ‘comparator group’ of each organisation responsible for delivering maternity care. In the absence of detailed clinical data, to help account for the variation between organisations due to their differences in risk profile, all of the Trusts and Health Boards have been classified hierarchically into five mutually exclusive comparator groups based on their level of service provision. They are then compared to the average mortality rate within their comparator group. See section 1.7 for full details of the groups.
3.4. 95% confidence intervals
The reported 95% confidence intervals for the stabilised & adjusted mortality rate are obtained through bootstrap methods:
- J organisations are sampled with replacement (where J is the total number of organisations).
- The multilevel model is estimated for the sample, keeping each appearance of an organisation distinct if it is sampled more than once.
- The estimated value, and prediction error, of the random term is obtained for each organisation: δ̂j and err̂or(δj) - if an organisation is sampled more than once then a single set of values is selected at random.
- The bootstrap estimates for the fixed terms are noted (α*, β* and Γ*).
- A new value (δj*) for the organisation-specific random term is sampled, where δj* ~ N(δ̂j , err̂or[δj]).
- The bootstrap stabilised & adjusted mortality rate (mj) is obtained by substituting α*, β*, Γ* and δj* for α, β, Γ and δj as appropriate.
- This is repeated 1,500 times, giving approximately 1,000 values for the bootstrap stabilised & adjusted mortality rate for each organisation since organisations are not necessarily included in each bootstrap sample.
- The lower and upper limits of the 95% confidence interval are obtained for each organisation from the 2.5th and 97.5th percentiles respectively of the distribution the bootstrap stabilised & adjusted mortality rates.
3.5. Probability of being outside the expected range
The statistical methodology used allows the calculation of empirical Bayes posterior probabilities to estimate the probability that the underlying mortality rate for an organisation falls above (or below) a specified benchmark; for example, it would be possible to report the probability that the underlying stabilised & adjusted mortality rate for organisation j is greater than 6 per 1,000 births (mj > 6.0). In MBRRACE-UK reporting, organisations have been identified when the probability that they fall above, or below, a specified benchmark is greater than 0.5; that is, ‘it is more likely than not’ that their underlying mortality rate falls outside the benchmark.
3.6. Missing data
Where information is unavailable for the risk-adjustment factors because it is missing from the routine data source, in order to allow all appropriate births to be included in the analyses the missing values are assumed to fall into the following categories:
- mother’s age - 30 to 34 years;
- socioeconomic deprivation - middle quintile;
- baby’s sex - male;
- baby's ethnicity - White;
- multiplicity - singleton;
- gestational age at birth - 37 to 41 completed weeks.
Since missing observations are imputed with values generally representing low risk groups, stabilised & adjusted mortality rates are potentially overestimated for those organisations with missing data. However, as the proportion of missing data is low, and the effect of adjustment is relatively small, any overestimation will be small and unlikely to change any conclusions inferred from the reported rates.
4. Data items reported to MBRRACE-UK
All the data items we collect for each death are listed in a spreadsheet, which you can download as an Excel file.
5. Important terms and abbreviations we use
5.1 Types of baby deaths
| Type of death | Definition |
|---|---|
| Late fetal loss | A baby born between 22 and 23 completed weeks’ gestational age showing no signs of life, irrespective of when the death occurred. |
| Stillbirth | A baby born at or after 24 completed weeks’ gestational age showing no signs of life, or with a birthweight of 400g or more where an accurate estimate of gestation is not available, irrespective of when the death occurred. |
| Antepartum stillbirth | A baby born at or after 24 completed weeks’ gestational age showing no signs of life and known to have died before the onset of care in labour. |
| Intrapartum stillbirth | A baby born at or after 24 completed weeks’ gestational age showing no signs of life and known to have been alive at the onset of care in labour. |
| Neonatal death | A liveborn baby (born at 20 completed weeks’ gestational age or later, or with a birthweight of 400g or more where an accurate estimate of gestation is not available), who died before 28 completed days after birth. |
| Early neonatal death | A liveborn baby (born at 20 completed weeks’ gestational age or later, or with a birthweight of 400g or more where an accurate estimate of gestation is not available) who died before 7 completed days after birth. |
| Late neonatal death | A liveborn baby (born at 20 completed weeks’ gestational age or later, or with a birthweight of 400g or more where an accurate estimate of gestation is not available) who died after 7 completed days but before 28 completed days after birth. |
| Perinatal death | A stillbirth or early neonatal death. |
| Extended perinatal death | A stillbirth or neonatal death. |
| Termination of pregnancy | The deliberate ending of a pregnancy, normally carried out before the embryo or fetus is capable of independent life. |
5.2. Key terms
| Term | Definition |
|---|---|
| Comparator group | A collection of similar NHS Trusts and Health Boards grouped together based on the complexity and volume of care they provide, such as whether they have a neonatal intensive care unit (NICU) and how many babies are born there. |
| Congenital anomalies | Health conditions or differences a baby is born with that affect how their body develops or works. |
| Crown Dependency | One of three self-governing islands (Isle of Man, Jersey, and Guernsey) that are not part of the United Kingdom, where the UK maintains a relationship of support and partnership. |
| Deprivation quintile | One of five equal groups used to rank areas from least deprived (Quintile 1) to most deprived (Quintile 5) based on socioeconomic hardship and lack of resources. |
| Gestational age | How far along the pregnancy was when the baby was born. This is measured in completed weeks of pregnancy. We mostly report on deaths of babies born at 24 weeks or later. |
| Health & Social Care Trust | An organisation in Northern Ireland that manages staff and is responsible for delivering both health and social care services within a region. |
| Health Board | An organisation in Wales or Scotland responsible for the protection and improvement of health, and the delivery of all NHS healthcare services within a geographical area. |
| Integrated care board | A statutory NHS organisation in England that manages the NHS budget, plans for the health needs of the population, and arranges for the provision of services in a specific area. |
| Local authority | A local council responsible for improving the health of its resident population, including providing children's public health services from pregnancy up to age five. |
| Mortality rate | The number of baby deaths per 1,000 births in a population or organisation. |
| Crude mortality rate | The mortality rate for an organisation without any statistical smoothing to account for random chance variations caused by the small number of births and deaths, or adjustment for the specific risks or health profiles of the mothers and babies it cares for. |
| Stabilised mortality rate | The mortality rate for an organisation after being statistically smoothed to account for random chance variations caused by the small number of births and deaths, but without adjusting for population risk factors. |
| Stabilised and adjusted mortality rate | The mortality rate for an organisation after being statistically smoothed to account for random chance variations caused by the small number of births and deaths, and adjusted to account for differences in risk profile of the mothers and babies it cares for. |
| Neonatal network | A structured group of maternity and newborn care units across a geographical area that work together to ensure the best care for every pregnant woman and newborn baby. |
| Neonatal Intensive Care Unit | A specialised hospital unit that provides the highest level of medical care for the most complex or prematurely born newborns. |
| NHS Trust | An organisation within the English NHS that is generally responsible for running hospital services in a geographical area, with some focusing specifically on maternity and neonatal care. |
| Standardised Mortality Ratio | The ratio of the observed number of baby deaths to the expected number of baby deaths for an organisation, after adjustment for differences in risk profile of the mothers and babies it cares for. |
5.3. Abbreviations
| BMI | Body Mass Index |
| CHI | Community Health Index (Scotland) |
| CI | Confidence Interval |
| CODAC | Cause Of Death & Associated Conditions |
| HQIP | Healthcare Quality Improvement Partnership |
| ICB | Integrated Care Board |
| ICS | Integrated Care System |
| LFL | Late Fetal Loss |
| MBRRACE-UK | Mothers and Babies: Reducing Risk through Audits and Confidential Enquiries across the UK |
| MNI-CORP | Maternal, Newborn and Infant Clinical Outcome Review Programme |
| NICU | Neonatal Intensive Care Unit |
| NIMACH | Northern Ireland Maternal and Child Health |
| NIMATS | Northern Ireland Maternity System |
| NISRA | Northern Ireland Statistics and Research Agency |
| NRS | National Records of Scotland |
| ONS | Office for National Statistics |
| PDS | Personal Demographics Service |
| PHS | Public Health Scotland |
| PMRT | Perinatal Mortality Review Tool |
| RCOG | Royal College of Obstetricians and Gynaecologists |
| SMR | Standardised Mortality Ratio |
| SMR02 | Maternity Inpatient and Day Case Dataset (Scotland) |
6. Additional information
6.1. Funding
The Maternal, Newborn and Infant Clinical Outcome Review Programme, delivered by MBRRACE-UK, is commissioned by the Healthcare Quality Improvement Partnership (HQIP) and funded by NHS England and the Governments of Wales, Northern Ireland, Jersey, Guernsey, Scotland and the Isle of Man as part of the National Clinical Audit and Patient Outcomes Programme.
6.2. Stakeholder involvement
Groups that support parents and families play a vital role in the MBRRACE-UK programme. They're part of a special group called the Third Sector stakeholders. These organisations help us in a few key ways:
- They help us figure out what new research we should focus on in the future.
- They're crucial in sharing our important findings and messages with parents, families, the wider public, and those who make policy decisions. This includes helping us create easy-to-understand summaries of our reports.
There is a full list of organisations in the acknowledgements.
6.3. How to refer to this guide
Please use this reference if you mention this guide:
Gallimore ID, Matthews RJ, Page GL, Smith LK, Fenton AC, Knight M, Smith PW, Redpath S, Manktelow BN, on behalf of the MBRRACE-UK Collaboration. Understanding how we report on baby deaths in the UK: A guide to our methods. Leicester: TIMMS, School of Healthcare, University of Leicester. 2026.
Published by:
TIMMS
School of Healthcare
University of Leicester
George Davies Centre
University Road
Leicester LE1 7RH
7. Version history
| Version | Details of changes | Release date |
|---|---|---|
| 1.0. | First release | 10/12/2020 |
| 1.1. | Data sources for Scotland updated | 14/10/2021 |
| 1.2. | Section 3.2. "The system for online data submission" updated | 14/09/2023 |
| 1.3. | Section 2. "Statistical methods" updated. Sections 2.1. and 2.2. simplified. | 20/02/2024 |
| 1.4. | Section 2.3. "Risk-adjustment factors" updated. Link to revised child poverty measures added. | 05/02/2025 |
| 2.0. | Version 1 archived. New version 2 in Plain English published. | 11/06/2026 |